

Civil infrastructure construction company Sterling Infrastructure (NASDAQ: STRL) reported revenue ahead of Wall Street’s expectations in Q4 CY2025, with sales up 51.5% year on year to $755.6 million. The company’s full-year revenue guidance of $3.13 billion at the midpoint came in 10.7% above analysts’ estimates. Its non-GAAP profit of $3.08 per share was 17% above analysts’ consensus estimates.
Is now the time to buy Sterling? Find out by accessing our full research report, it’s free.
Sterling (STRL) Q4 CY2025 Highlights:
- Revenue: $755.6 million vs analyst estimates of $639.4 million (51.5% year-on-year growth, 18.2% beat)
- Adjusted EPS: $3.08 vs analyst estimates of $2.63 (17% beat)
- Adjusted EBITDA: $142.1 million vs analyst estimates of $128.4 million (18.8% margin, 10.7% beat)
- Adjusted EPS guidance for the upcoming financial year 2026 is $13.75 at the midpoint, beating analyst estimates by 13.9%
- EBITDA guidance for the upcoming financial year 2026 is $642.5 million at the midpoint, above analyst estimates of $580.9 million
- Operating Margin: 0.9%, down from 12.5% in the same quarter last year
- Free Cash Flow Margin: 21.1%, down from 31.8% in the same quarter last year
- Market Capitalization: $14.12 billion
(1) See "Non-GAAP Measures", "Adjusted Net Income Reconciliation", and "EBITDA Reconciliation" sections below for more information.
Company Overview
Involved in the construction of a major highway, the Grand Parkway in Houston, TX, Sterling Infrastructure (NASDAQ: STRL) provides civil infrastructure construction.
Revenue Growth
A company’s long-term sales performance is one signal of its overall quality. Any business can have short-term success, but a top-tier one grows for years. Over the last five years, Sterling grew its sales at an impressive 11.8% compounded annual growth rate. Its growth surpassed the average industrials company and shows its offerings resonate with customers, a great starting point for our analysis.
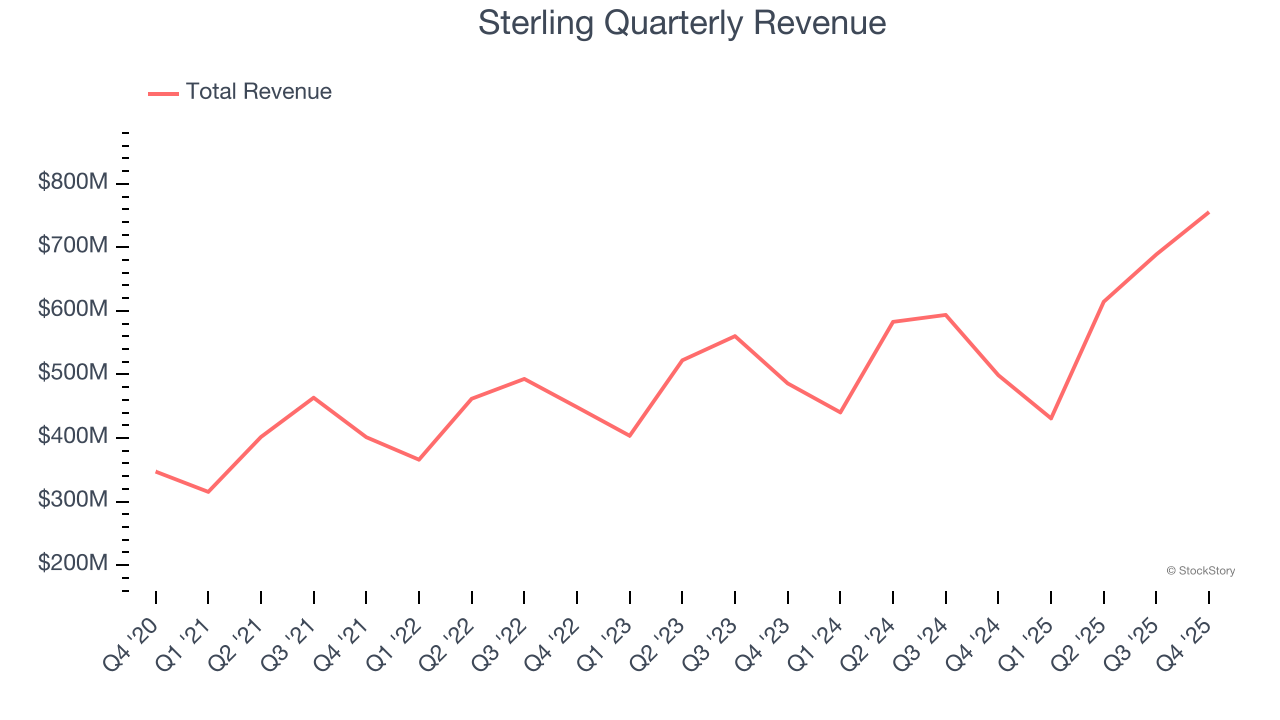
Long-term growth is the most important, but within industrials, a half-decade historical view may miss new industry trends or demand cycles. Sterling’s annualized revenue growth of 12.4% over the last two years aligns with its five-year trend, suggesting its demand was predictably strong. 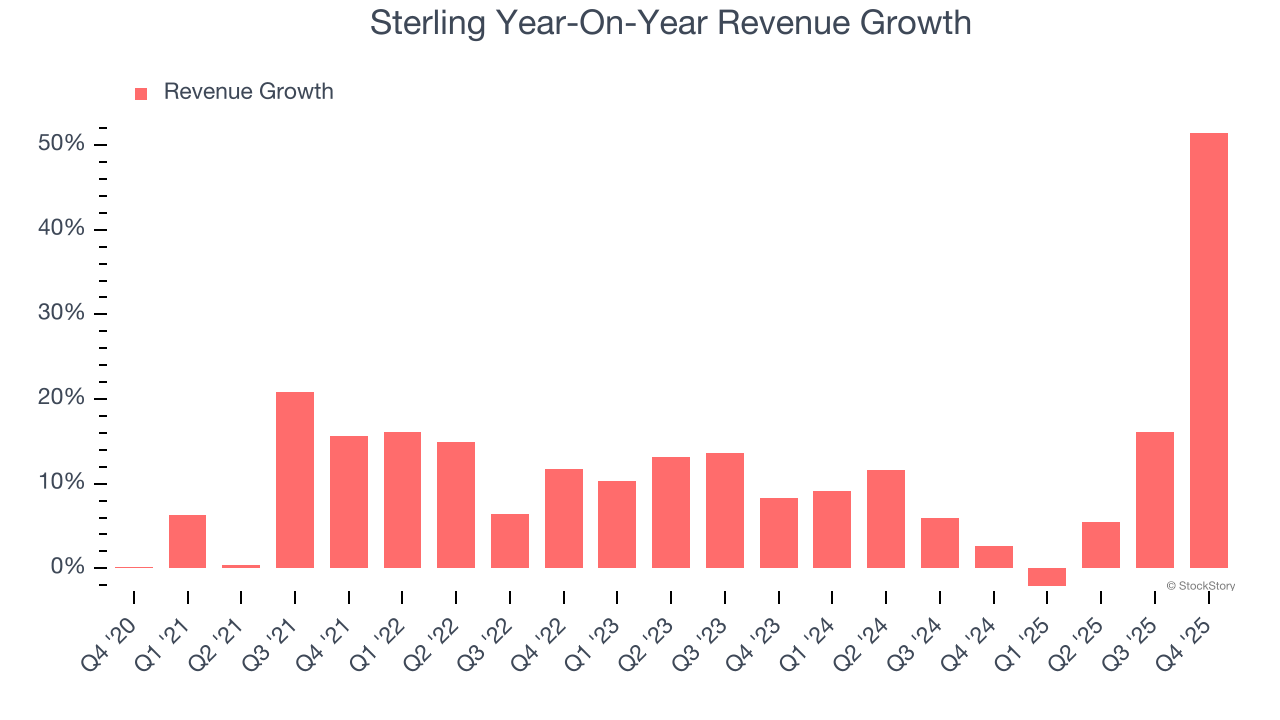
This quarter, Sterling reported magnificent year-on-year revenue growth of 51.5%, and its $755.6 million of revenue beat Wall Street’s estimates by 18.2%.
Looking ahead, sell-side analysts expect revenue to grow 13.2% over the next 12 months, similar to its two-year rate. This projection is admirable and suggests the market is forecasting success for its products and services.
Microsoft, Alphabet, Coca-Cola, Monster Beverage—all began as under-the-radar growth stories riding a massive trend. We’ve identified the next one: a profitable AI semiconductor play Wall Street is still overlooking. Go here for access to our full report.
Operating Margin
Operating margin is one of the best measures of profitability because it tells us how much money a company takes home after procuring and manufacturing its products, marketing and selling those products, and most importantly, keeping them relevant through research and development.
Sterling has managed its cost base well over the last five years. It demonstrated solid profitability for an industrials business, producing an average operating margin of 10.6%. This result was particularly impressive because of its low gross margin, which is mostly a factor of what it sells and takes huge shifts to move meaningfully. Companies have more control over their operating margins, and it’s a show of well-managed operations if they’re high when gross margins are low.
Analyzing the trend in its profitability, Sterling’s operating margin rose by 5.5 percentage points over the last five years, as its sales growth gave it immense operating leverage.
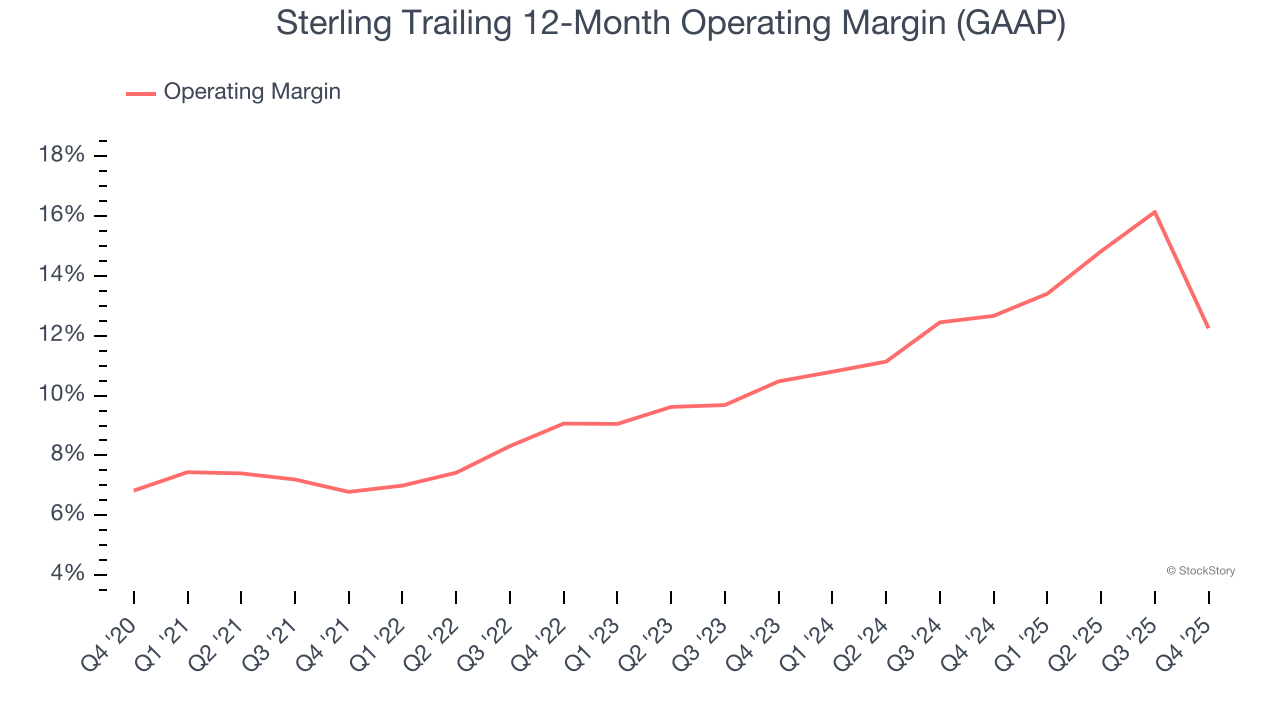
In Q4, Sterling’s breakeven margin was 0.9%, down 11.6 percentage points year on year. Since Sterling’s operating margin decreased more than its gross margin, we can assume it was less efficient because expenses such as marketing, R&D, and administrative overhead increased.
Earnings Per Share
Revenue trends explain a company’s historical growth, but the long-term change in earnings per share (EPS) points to the profitability of that growth – for example, a company could inflate its sales through excessive spending on advertising and promotions.
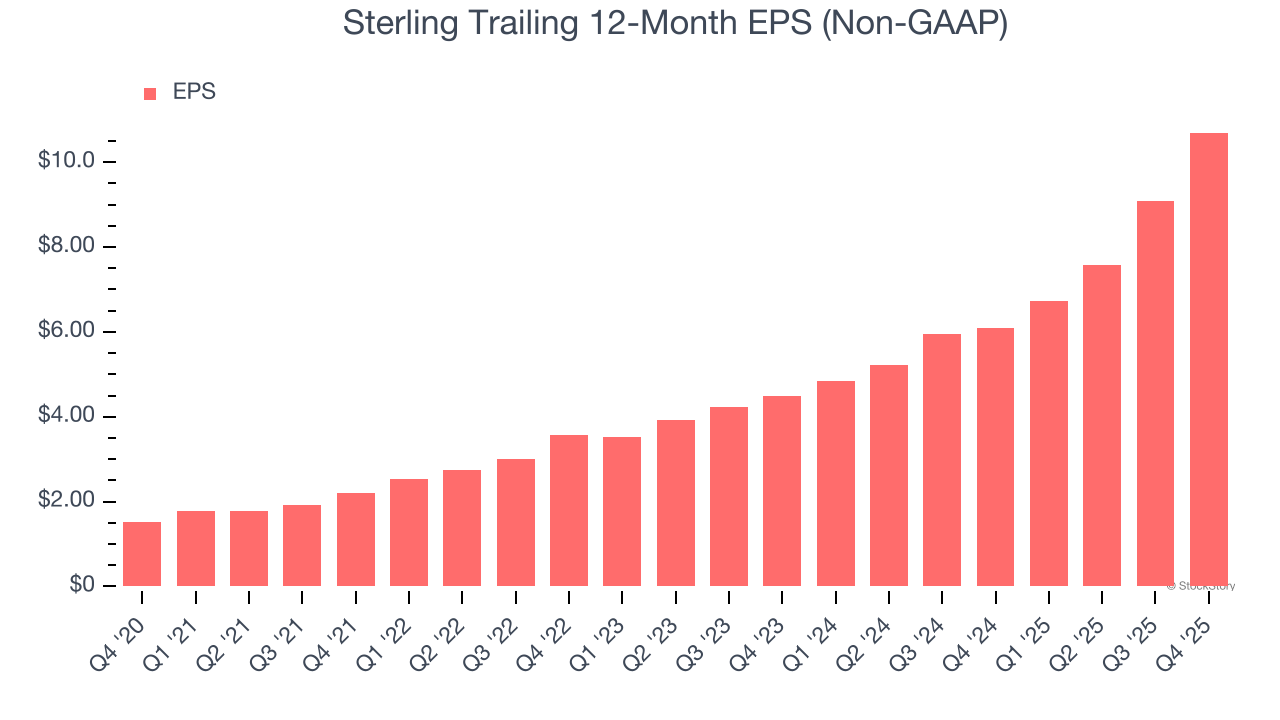
Sterling’s EPS grew at an astounding 47.7% compounded annual growth rate over the last five years, higher than its 11.8% annualized revenue growth. This tells us the company became more profitable on a per-share basis as it expanded.
Diving into the nuances of Sterling’s earnings can give us a better understanding of its performance. As we mentioned earlier, Sterling’s operating margin declined this quarter but expanded by 5.5 percentage points over the last five years. This was the most relevant factor (aside from the revenue impact) behind its higher earnings; interest expenses and taxes can also affect EPS but don’t tell us as much about a company’s fundamentals.
Like with revenue, we analyze EPS over a more recent period because it can provide insight into an emerging theme or development for the business.
For Sterling, its two-year annual EPS growth of 54.5% was higher than its five-year trend. We love it when earnings growth accelerates, especially when it accelerates off an already high base.
In Q4, Sterling reported adjusted EPS of $3.08, up from $1.46 in the same quarter last year. This print easily cleared analysts’ estimates, and shareholders should be content with the results. Over the next 12 months, Wall Street expects Sterling’s full-year EPS of $10.70 to grow 13.2%.
Key Takeaways from Sterling’s Q4 Results
We were impressed by how significantly Sterling blew past analysts’ EBITDA expectations this quarter. We were also excited its revenue outperformed Wall Street’s estimates by a wide margin. Zooming out, we think this was a good print with some key areas of upside. The stock traded up 5% to $483.50 immediately following the results.
Sterling put up rock-solid earnings, but one quarter doesn’t necessarily make the stock a buy. Let’s see if this is a good investment. What happened in the latest quarter matters, but not as much as longer-term business quality and valuation, when deciding whether to invest in this stock. We cover that in our actionable full research report which you can read here (it’s free).


