
Microsoft Corporation (MSFT) has been at the forefront of the AI-driven tech surge this year, with shares soaring over 40% year-to-date. The optimism surrounding the potential of AI has also stimulated record-breaking growth for the Nasdaq 100 in the first half of the year.
The hype around the new era of technology shows no sign of abating. The latest Markets Live Pulse survey revealed that an impressive 77% of the 514 respondents plan to increase or maintain their tech stock exposure over the subsequent six months, potentially inflating market valuations further.
MSFT is well-positioned to exploit the accelerating AI trend as it innovates to create intelligent machines that complement human reasoning.
Earlier this year, MSFT introduced its Copilot service, integrating into its Microsoft 365 software suite, using generative AI that enables it to more efficiently compose emails, summarize documents, analyze spreadsheet data, etc., and unlock a new wave of productivity growth. Consequently, it announced a new artificial intelligence subscription service for Microsoft 365 this month.
Additionally, significant upgrades were made to Bing Chat, Microsoft’s AI-powered chatbot.
While Microsoft is lagging behind Amazon.com, Inc. (AMZN) in cloud infrastructure, CEO Satya Nadella believes his company is leading when it comes to new artificial intelligence workloads such as OpenAI’s ChatGPT.
Despite its elevated valuation, a closer look at its robust financial metrics suggests a promising buying opportunity for investors seeking solid returns and long-term value.
Exploring Microsoft Corporation’s Earnings Rebound: Trends and Growth in Key Financial Metrics, 2020-2023
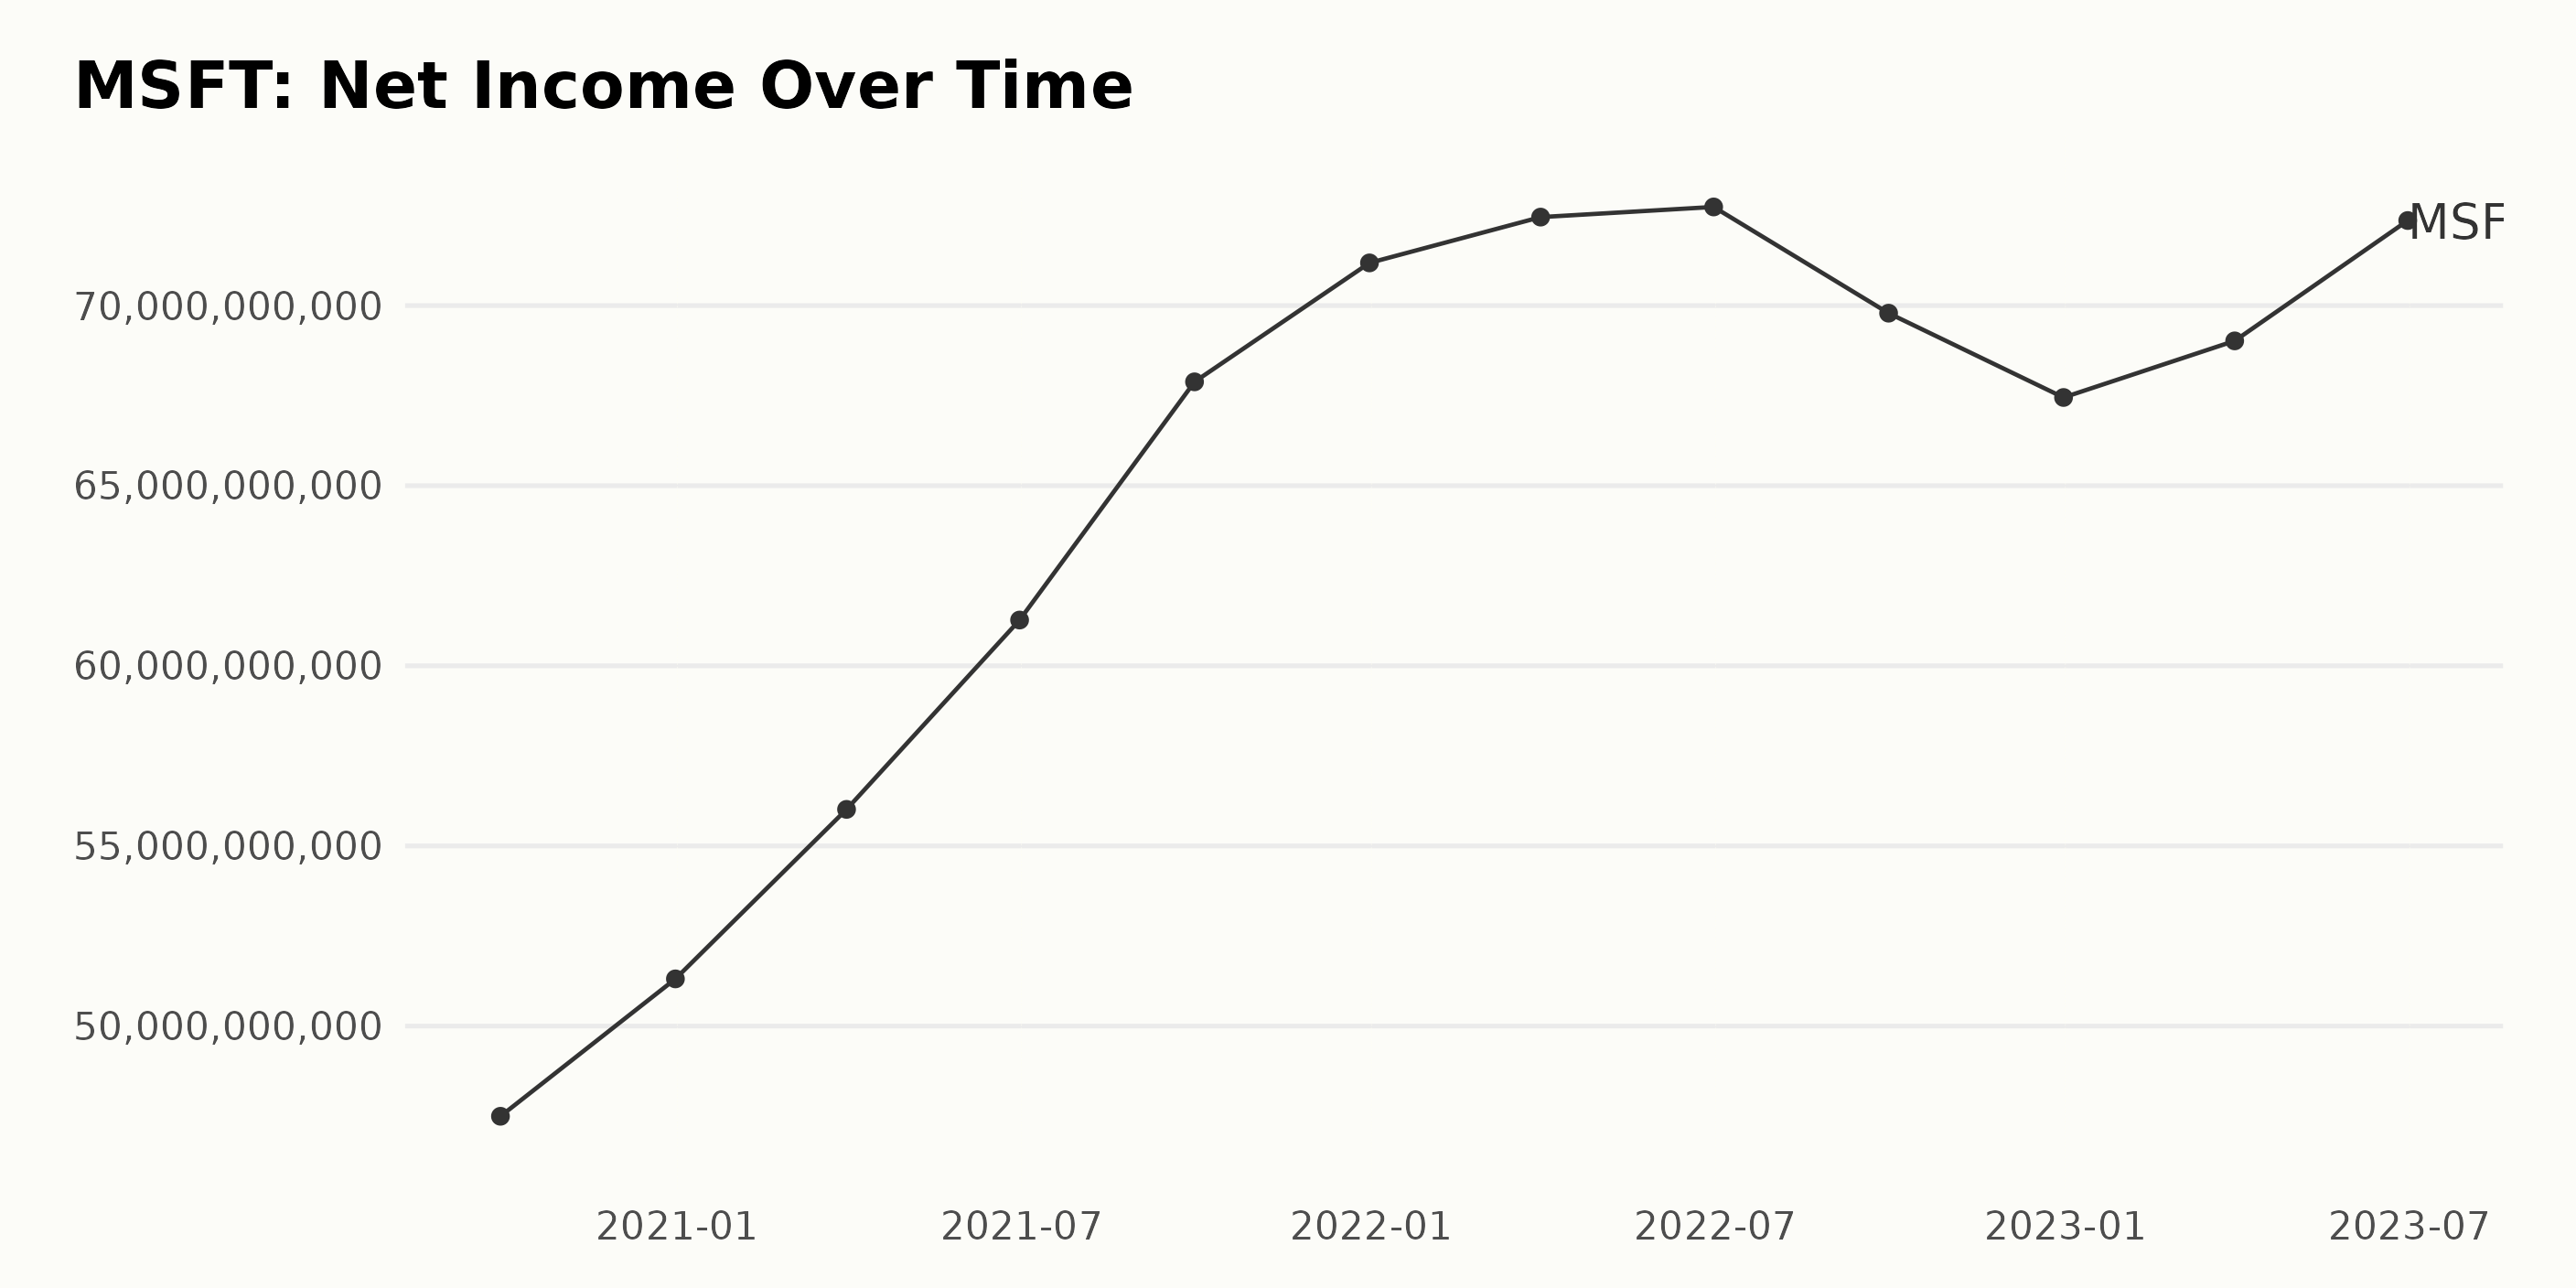
The trailing-12-month net income of MSFT showed a significant upward trend over the three-year period from September 2020 to June 2023. The data series commenced with a net income of $47.50 billion in September 2020, which has since experienced notable fluctuations.
- In December 2020, the net income increased to $51.31 billion, further growing to $56.02 billion by March 2021 and then to $61.27 billion in June 2021.
- A surge was observed in September 2021, when the net income peaked at $67.88 billion.
- Despite a slight drop to $67.45 billion in December 2021, the net income ascended to reach its highest value of $72.74 billion in June 2022.
- Notably, after reaching this peak, the net income experienced two consecutive quarters of decrease, falling to $69.79 billion in September 2022 and further to $67.45 billion in December 2022.
- However, there has been a resurgence since then, with net income bouncing back to $69.02 billion and $72.36 billion in March 2023 and June 2023, respectively.
Considering all fluctuations within the three years, the net income of Microsoft Corporation grew approximately 53% from the first recorded value in September 2020 to the final value in June 2023.
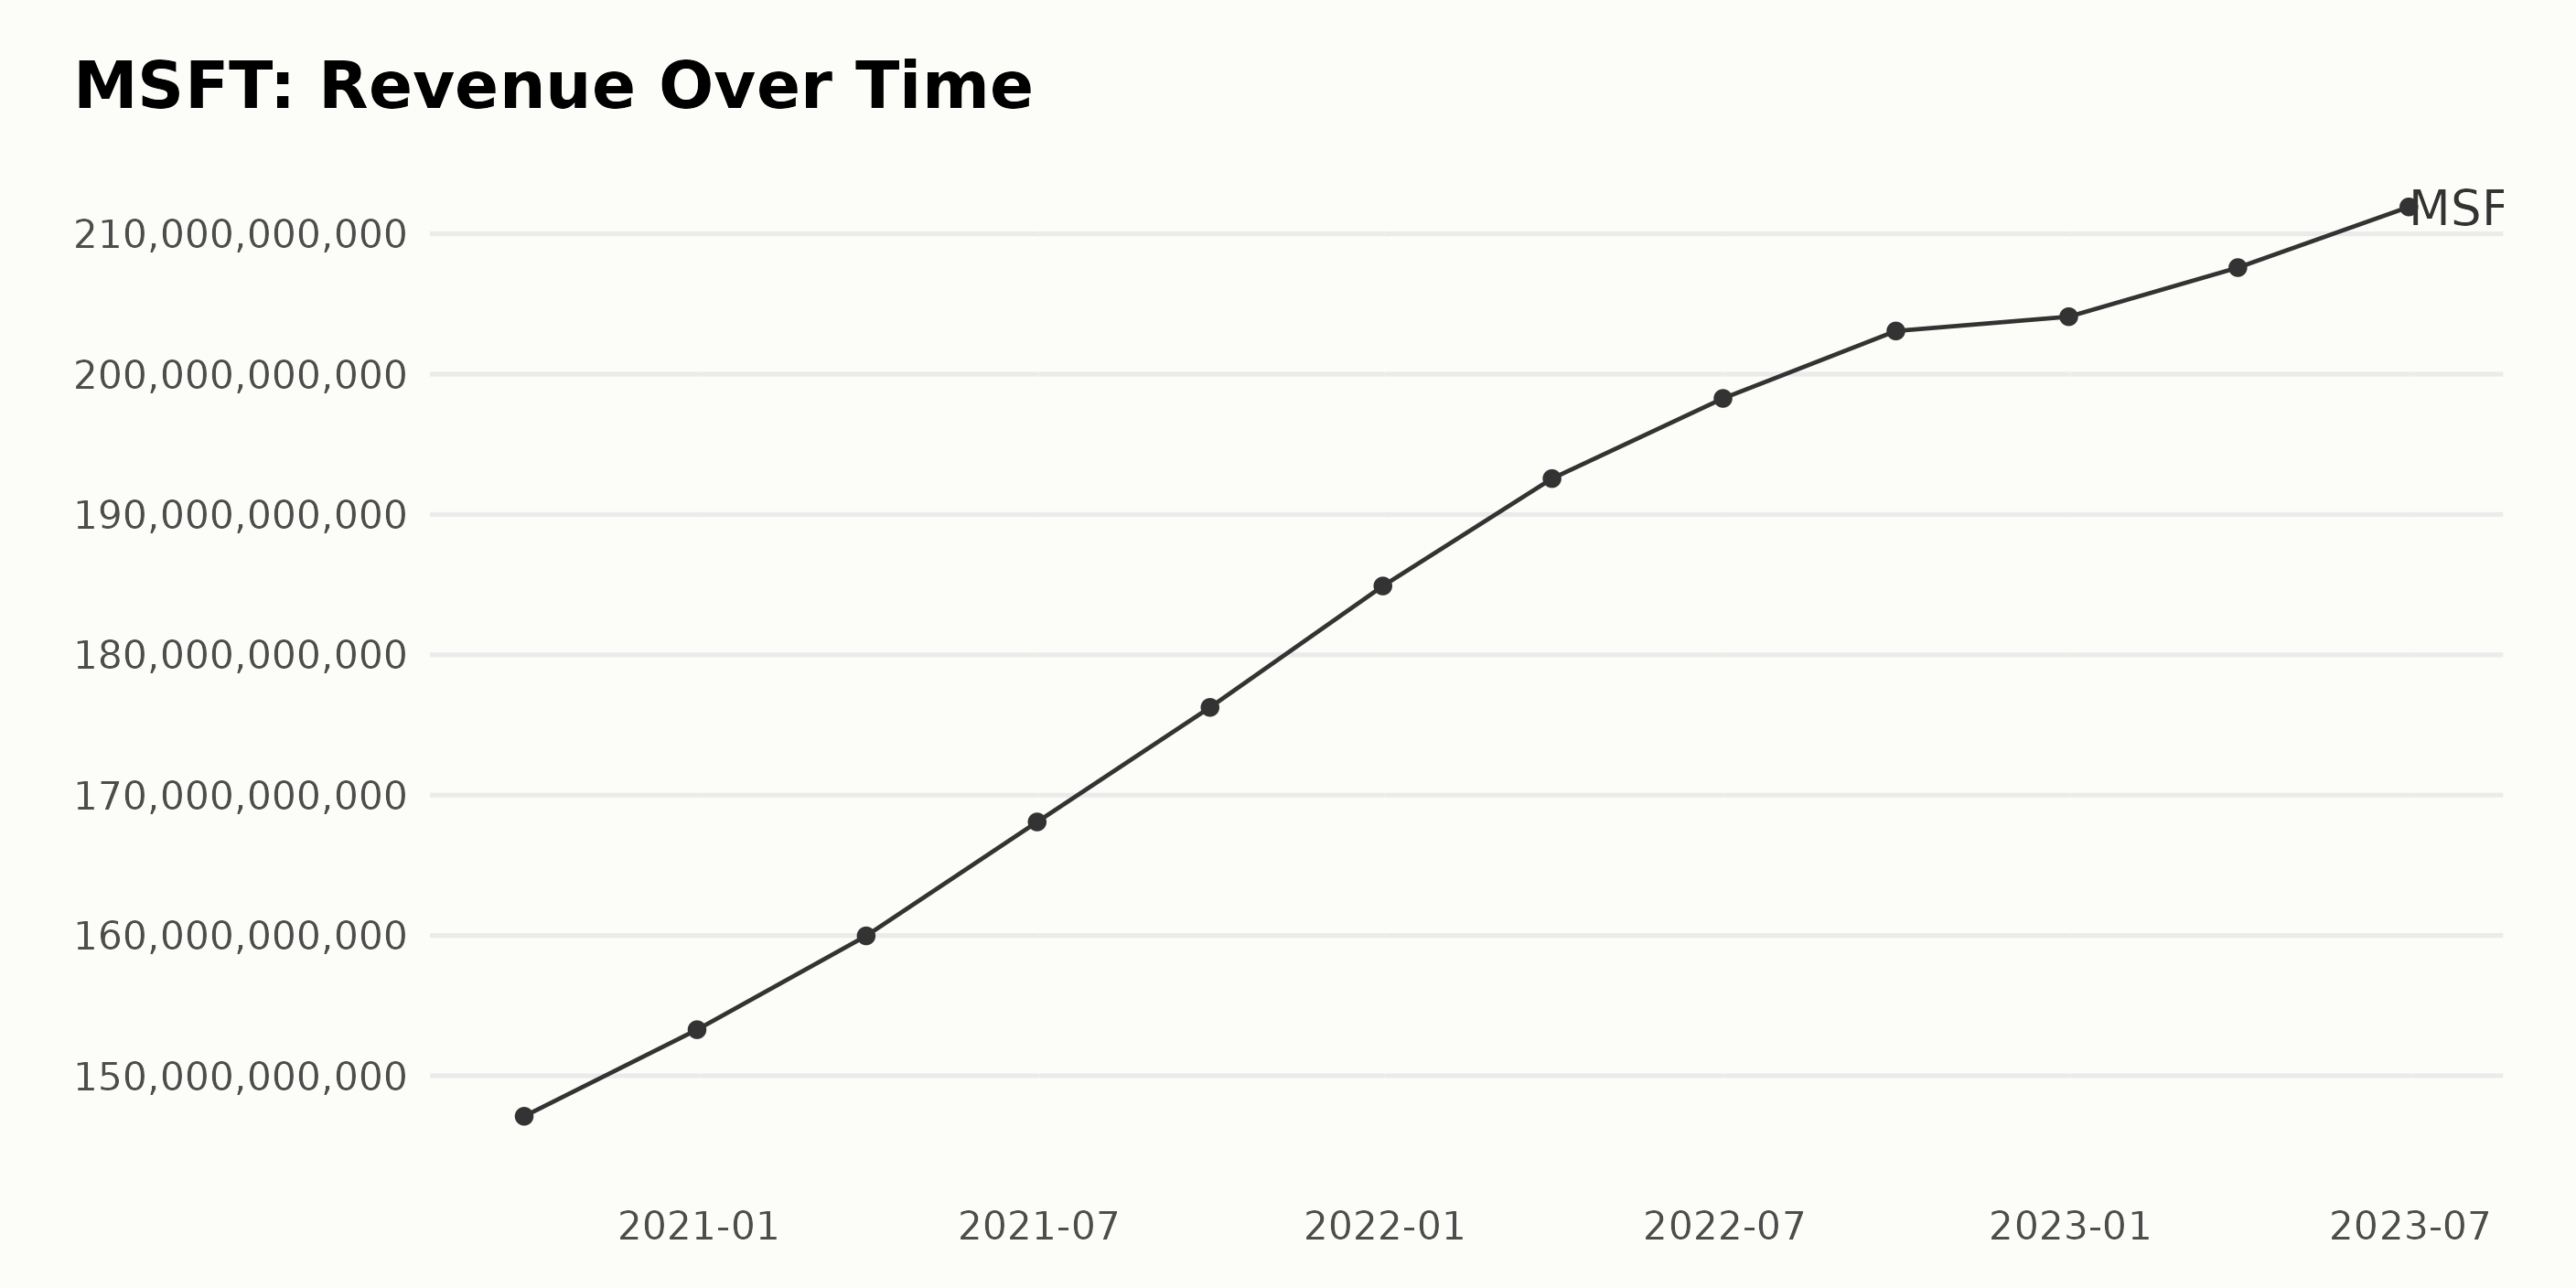
The trailing-12-month revenue trend of MSFT has demonstrated steady growth throughout the years 2020 to 2023, with several fluctuations. Here’s a summarised timeline:
- September 2020: Revenue of $147.11 billion.
- December 2020: Increment to $153.28 billion.
- March 2021: Growth continues to $159.97 billion.
- June 2021: Ascends to $168.09 billion.
- September 2021: An increase to $176.25 billion.
- December 2021: Swells to $184.9 billion.
- March 2022: Floated to $192.56 billion.
- June 2022: Climbs to $198.27 billion.
- September 2022: Further rises to $203.08 billion.
- December 2022: A smaller growth step to $204.09 billion.
- March 2023: Propelled to $207.59 billion.
- June 2023: Completes the timeline at $211.92 billion.
In conclusion, over the reported period, MSFT’s revenue has shown a healthy increase from $147.11 billion in September 2020 to $211.92 billion in June 2023, denoting a growth rate of approximately 44%.
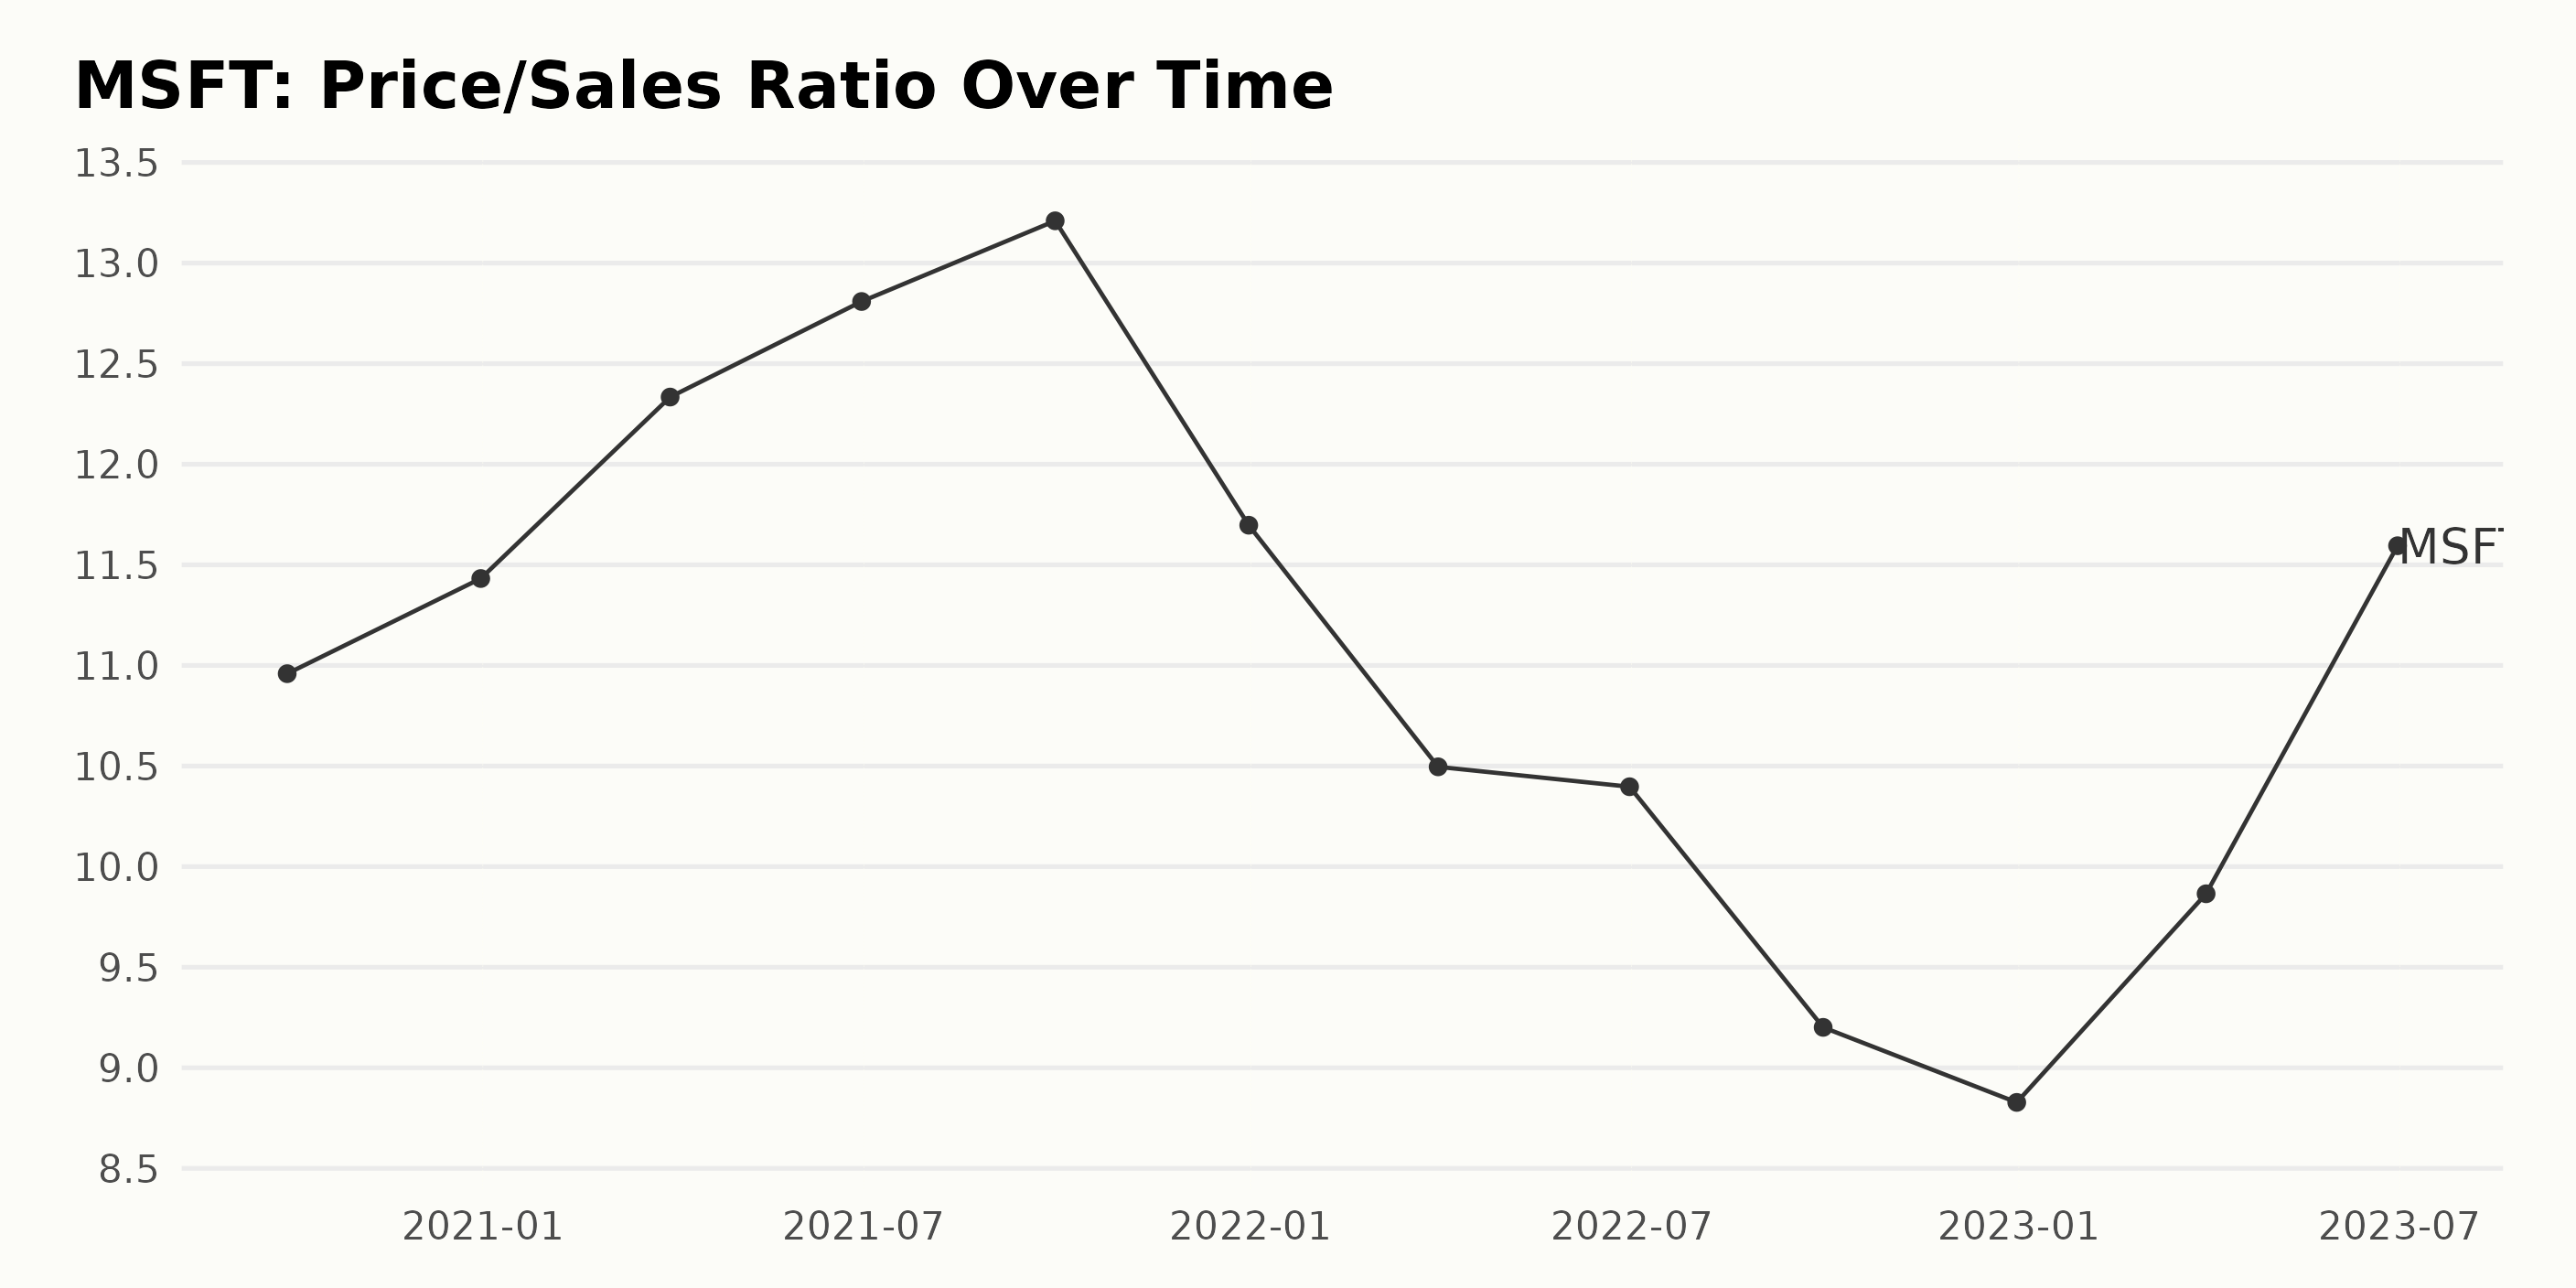
MSFT’s Price/Sales Ratio (P/S) has experienced growth and decline over the reported period, exhibiting some fluctuation. Key Trends:
- From September 2020 to September 2021, there was a consistent rise in the P/S of MSFT. It climbed from 10.96 in September 2020, reaching a peak of 13.21 by September 2021.
- However, a constant decline was noted from September 2021 through December 2022, with the P/S falling to 8.83, indicating a slump in the company’s market valuation relative to its sales.
- In contrast to the previous trend, the P/S increased from December 2022 to June 2023, growing from 8.83 to 11.59.
Growth Rate: - Notably, using the first and the last recorded values, the P/S increased from 10.96 in September 2020 to 11.59 in June 2023. This represents a modest growth rate of approximately 5.7%. The P/S value in March 2023 was 9.87, which increased progressively to 11.59 in June 2023. This shows a recent upward trend in MSFT’s Price/Sales ratio.
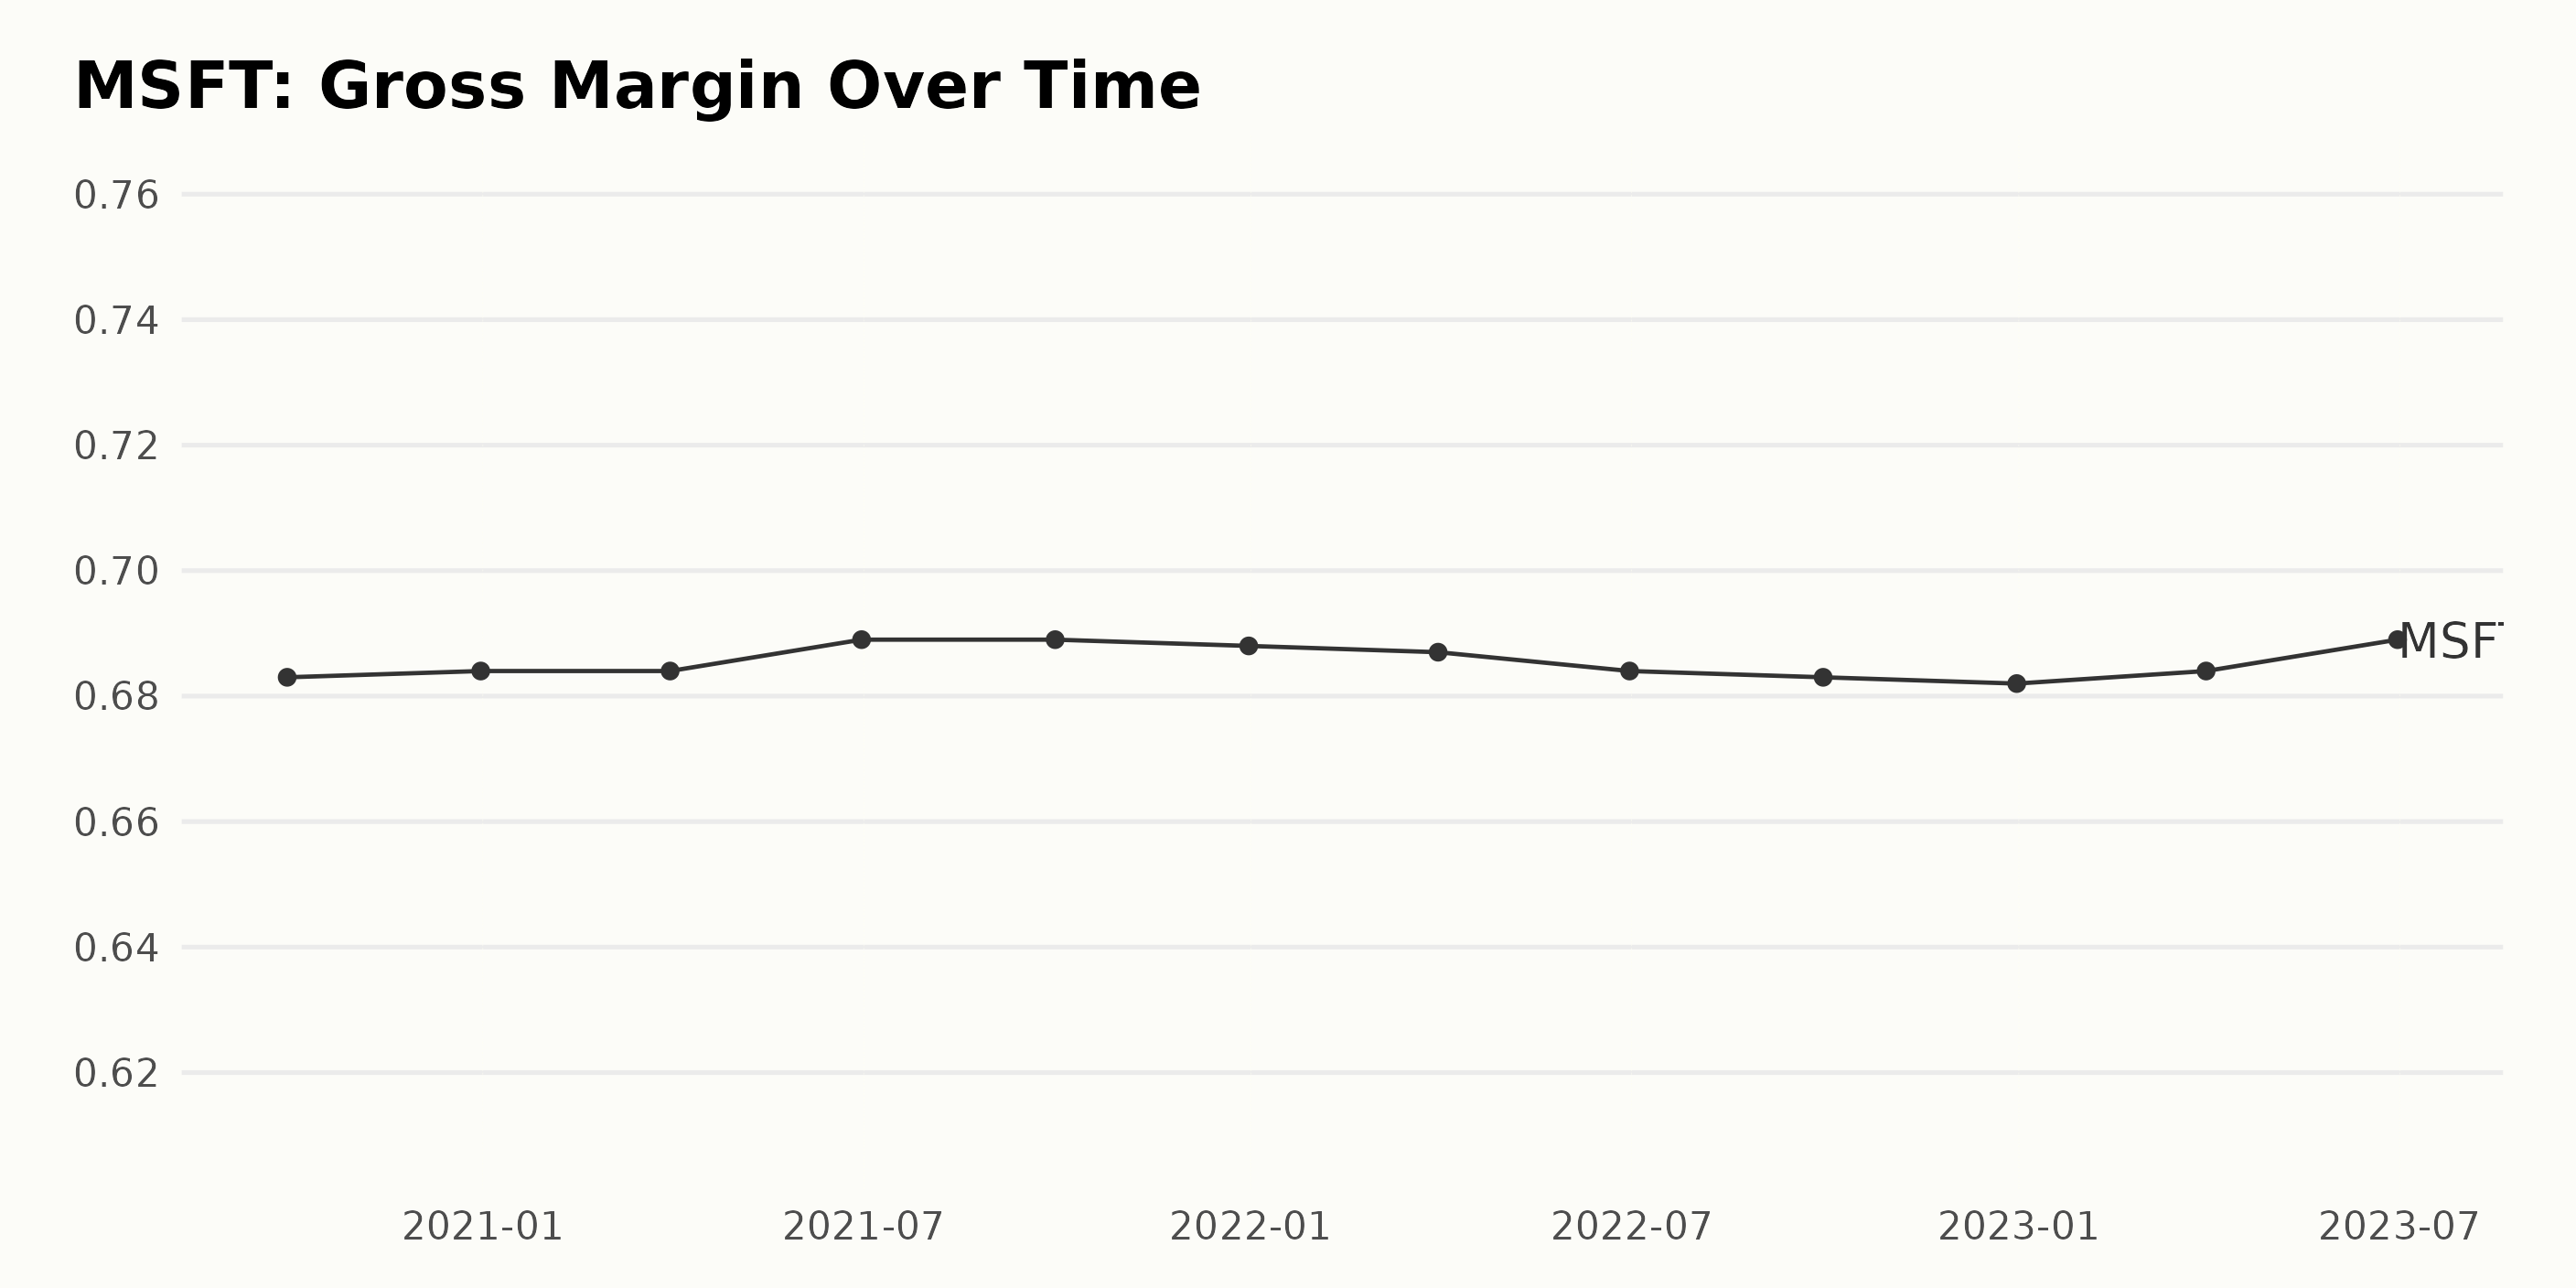
Here is the summary of trends and fluctuations in the gross margin for MSFT:
- As of September 30, 2020, the gross margin for MSFT stood at 68.3%
- On December 31, 2020, it slightly increased to 68.4%.
- This figure remained constant at 68.4% as on March 31, 2021.
- The gross margin then rose in the next quarter ending June 30, 2021, shooting up to 68.9%.
- The figure maintained at 68.9% for the subsequent September 30, 2021 quarter.
- However, the figure slumped slightly to 68.8% by December 2021.
- By the end of the first quarter in 2022, i.e., March 31, the gross margin stood at 68.7%.
- There was a slight decline to 68.4% by June 30, 2022.
- By the end of the third quarter in 2022, i.e., September 30, the figure lowered further to 68.3%
- It declined to its lowest figure in this series at the end of 2022, at 68.2%.
- There was a recovery in the next quarter ending March 31, 2023, where the gross margin went up to 68.4%.
- Finally, the recent data till June 30, 2023, shows a considerable upturn here, reaching the higher band at 68.9%.
Observations:
- The highest gross margin happened twice in this data series, once in the second quarter of 2021 and then most recently in the second quarter of 2023, hitting 68.9%.
- The lowest point in the series occurred at the end of the year 2022, when it dropped to 68.2%.
- Overall, from the beginning value in September 2020 to the last value in June 2023, the gross margin grew by 0.6%.
Over this period, MSFT’s gross margin has shown slight fluctuations within a narrow band of approximately 0.7%. There have been minor ups and downs, but the overall trend is stable. The significant point is that despite some interim drops, the gross margin in more recent data, particularly June 2023, climbed to match its highest at 68.9%.
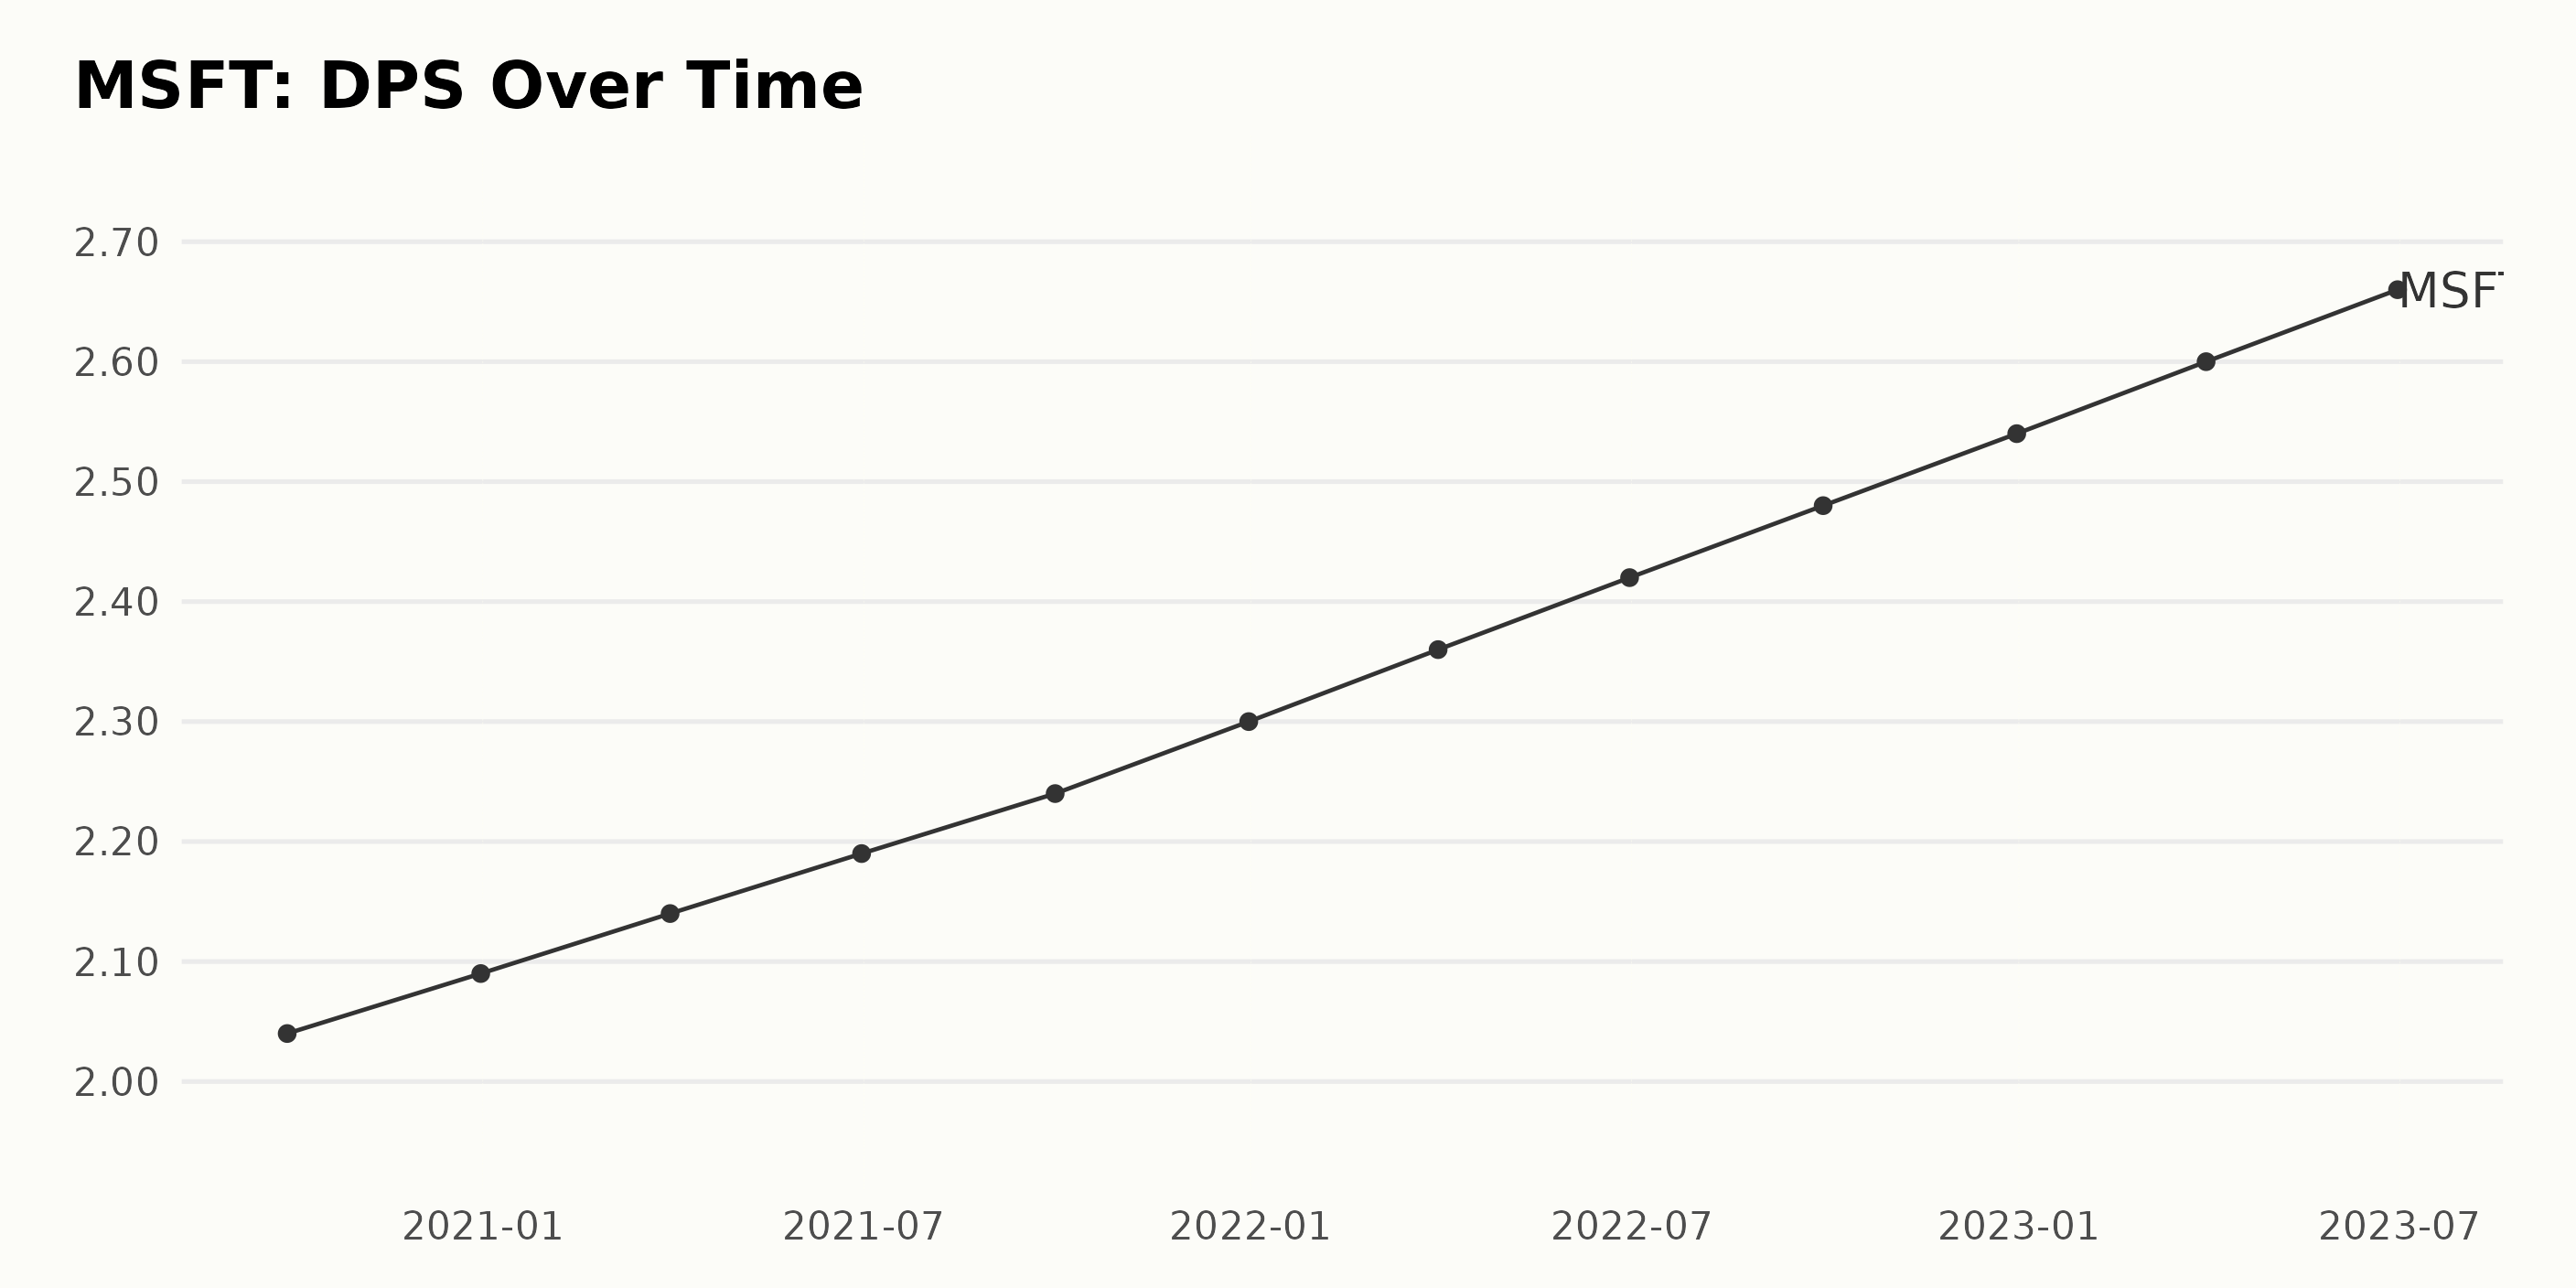
MSFT has consistently grown in Dividend Per Share (DPS) from September 2020 to June 2023. Detailed data highlights are as follows:
- Starting from a DPS of $2.04 in September 2020, MSFT increased its DPS gradually every quarter.
- In December 2020, an increment of $0.05 was noted, bringing the DPS to $2.09.
- Following the same trend, by June 2021, the DPS had reached $2.19 and grew to $2.24 in September 2021.
- The highest increase within a year was seen from September 2021 to September 2022, with a growth rate of approximately 11%, climbing to a DPS worth $2.48.
- The DPS trend maintained its upward trajectory, hitting $2.54 in December 2022.
- By June 2023, Microsoft’s DPS peaked at $2.66, marking an approximate total growth rate of 30% since September 2020.
The clear trend indicates an ongoing increase in MSFT’s DPS, emphasizing its ability to provide consistent shareholder returns. Although the growth rate has experienced slight fluctuations, the overall financial stability and growth prospect of MSFT remain steadily on the rise, with more emphasis on the most recent data that point to further growth.
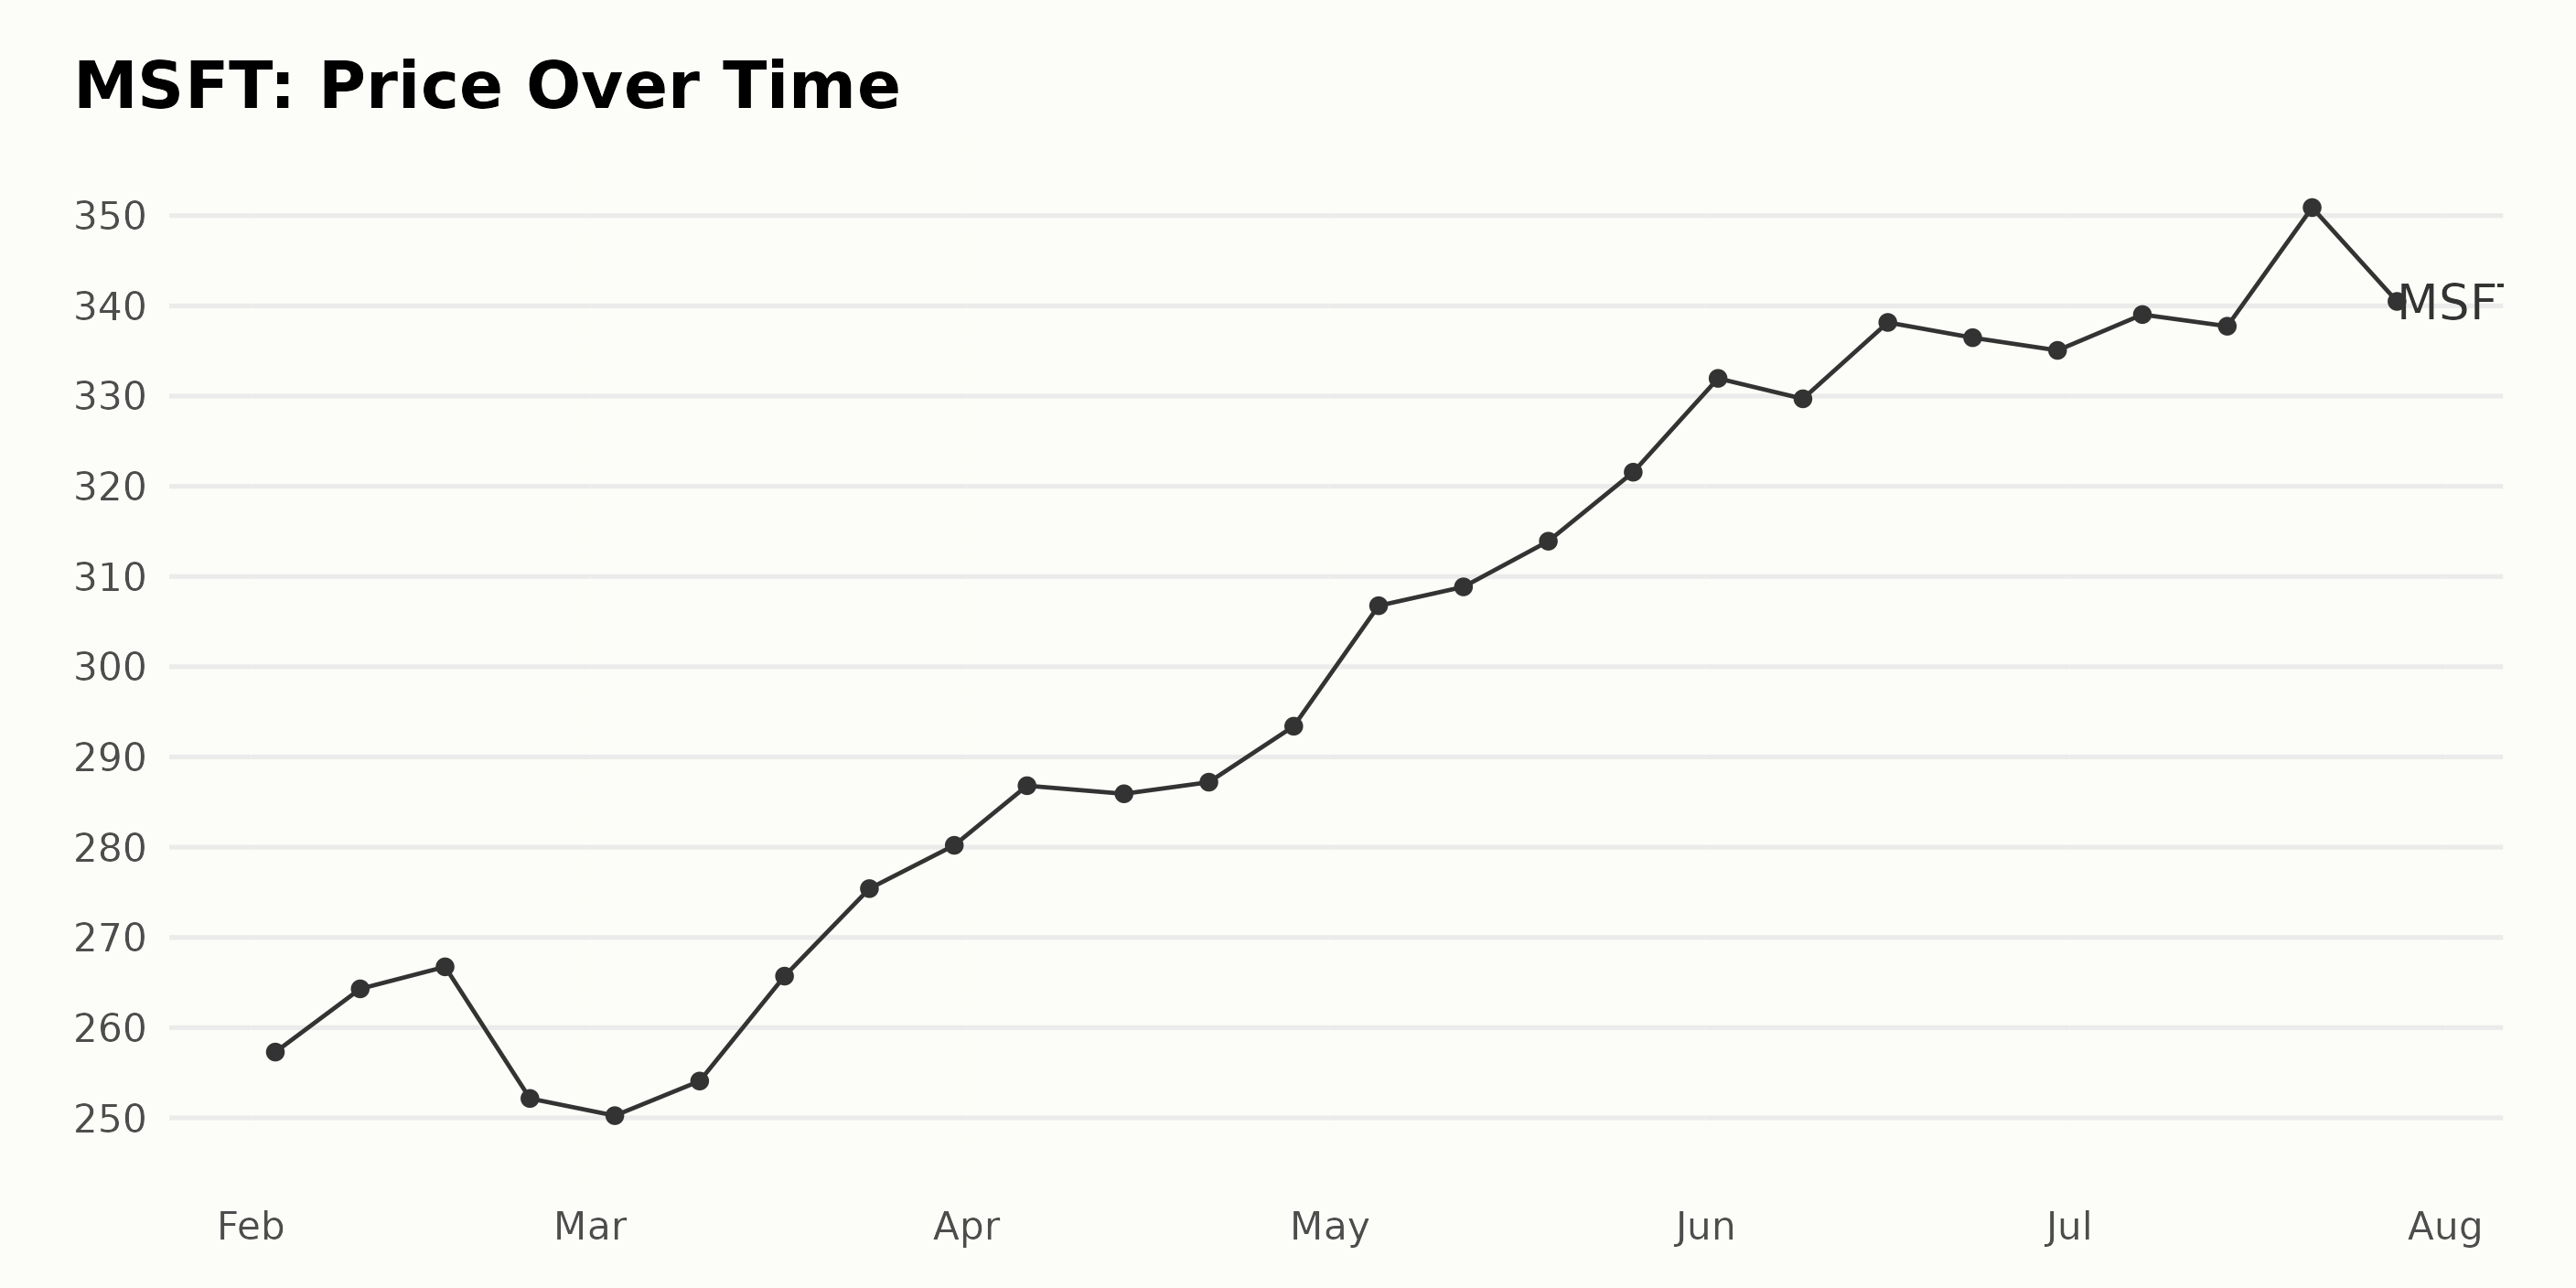
Analyzing the Robust Growth Trend of Microsoft’s Share Price from February to July 2023
A distinct inclining trend becomes apparent after examining the share price data provided for MSFT from February to July 2023.
- The share value kicked off with a price of $257.29 on February 3, 2023, slightly climbing to $264.29 by February 10. It further rose to $266.74 a week later, on February 17.
- However, a fall was observed by the end of February, with the price plummeting to $252.15, and a further drop to $250.24 occurred during the first week of March.
- This dip was quickly followed by an increase as it reached $254.08 during the second week of March, continuing a more robust upward pattern, soaring to $265.70 by March 17.
- An impressive jump was remarkable to $275.40 as of March 24, scaling to $280.20 on March 31.
- Throughout April, the stock price consistently stayed above $280. It began rising sharply in the following weeks, hitting $286.82, $285.92, $287.20, and $293.40 by April’s successive weeks, attesting to the company’s steady market performance.
- In May, the share price made a significant leap and closed at $306.76 in the first week. A continued upward climb lasted throughout May, with the maximum value being $321.56 on May 26.
- June saw a steady rise in the company’s share price, which peaked at $338.16 on June 16. Although the price remained relatively volatile, with minor fluctuations within the $330 range, the trend still maintained growth.
- It hit $339.04 in the first week of July and reached a high of $350.89 on July 21, suggesting confidence in MSFT’s performance. MSFT closed the last trading session at $338.37.
This includes a strong surge from May through July, demonstrating a bullish market for MSFT during this period. Overall, a considerable growth trend has been characterized for MSFT starting on February 3 and culminating on July 28, 2023. Here is a chart of MSFT’s price over the past 180 days.
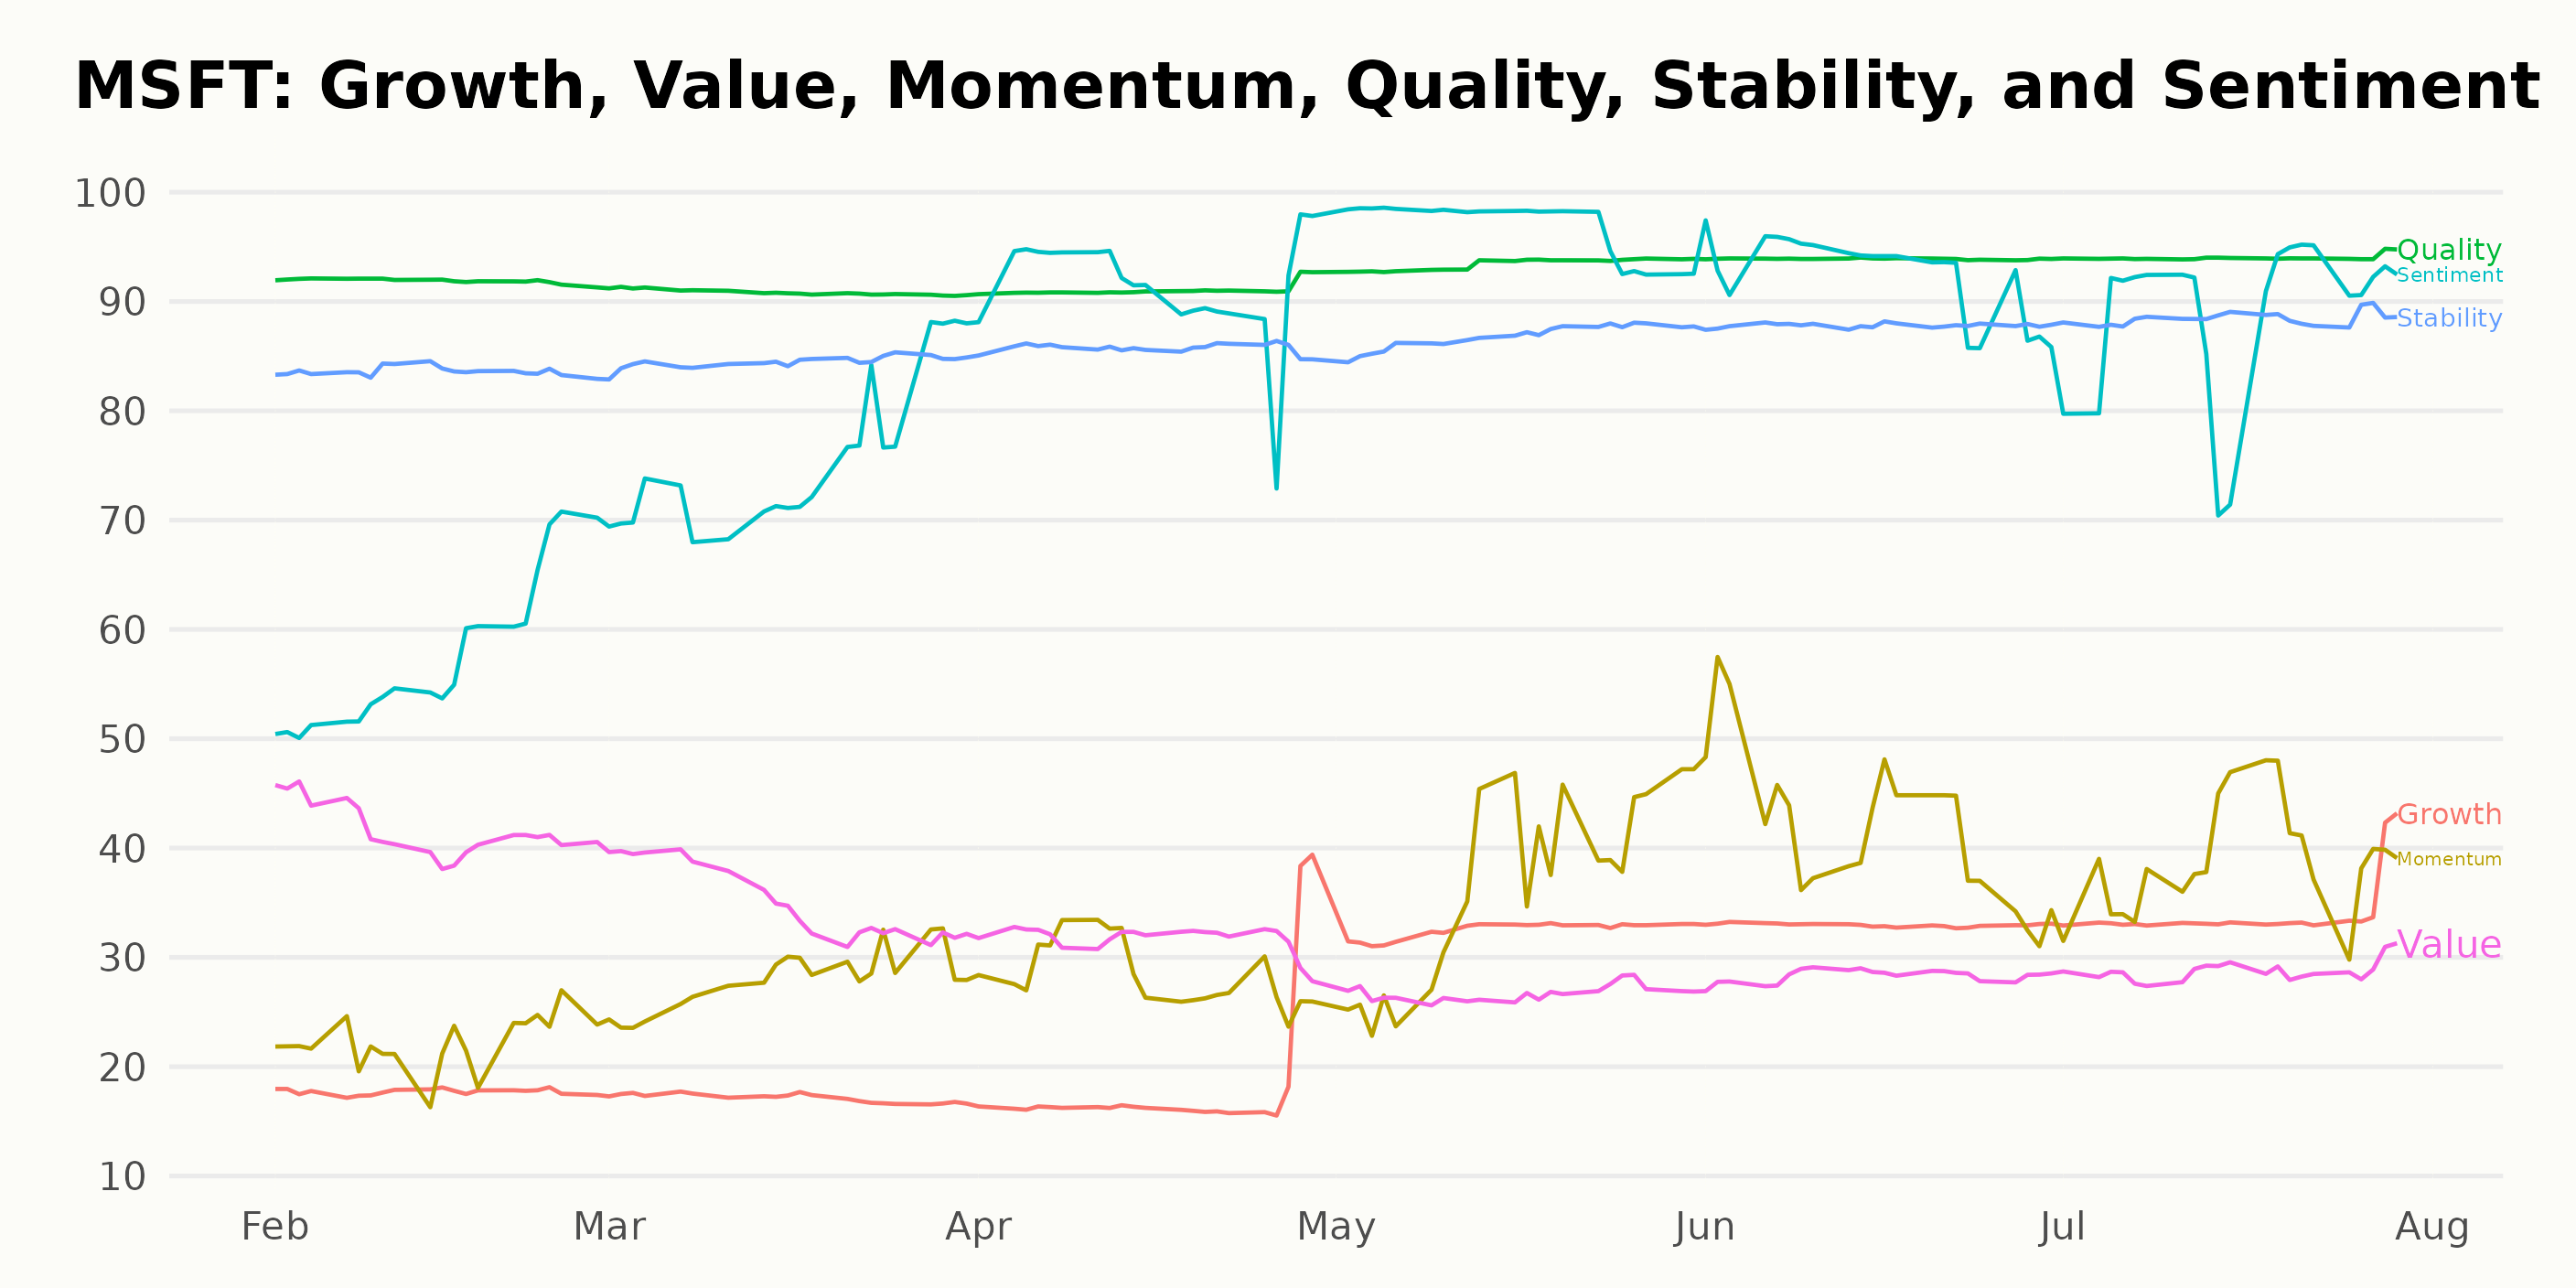
Decoding Microsoft’s Optimal Performance: Quality, Stability, and Sentiment Insights
MSFT has an overall B rating, translating to a Buy in our POWR Ratings system. It also has a B grade in Stability, Sentiment, and Quality. It is ranked #9 out of the 49 stocks in the Software - Business category.
A POWR Grade of B suggests that MSFT is performing quite well compared to its peers in the same industry category. Its B grade denotes above-average performance.
Furthermore, a rank within the category of 9 also confirms its advantageous position since the lower the rank, the superior the performance. This, therefore, implies that MSFT’s relative performance among the Software - Business category stocks is noteworthy.
The POWR Ratings for MSFT measure the company’s performance on six dimensions. Looking at the provided data, the three dimensions with the highest ratings consistently are Quality, Stability, and Sentiment. Let’s take a closer look at these key areas:
Quality: Microsoft’s quality score has remained noteworthy throughout, reaching its highest levels towards the latter part of the year. In February 2023, the quality dimension had a rating of 92; this value slightly dropped to 91 in March and April but increased to 93 by May 2023. The quality rating continued its upward movement and reached 94, which remained constant from June through July 2023.
Stability: Similarly, the stability dimension for Microsoft also shows a positive trend. It started at 84 in February and March 2023 but escalated to 86 by April. In the months following, the stability rating continued to grow, hitting 87 in May, 88 in June, and maintaining that score through July 2023.
Sentiment: Ratings in the sentiment aspect show significant growth. From an initial score of 57 in February 2023, it climbed to 76 in March and leaped significantly to 91 in April. By May, the sentiment was rated at 97, the highest value throughout the timespan. Though it dipped slightly after, 92 in June and 89 in July, the general sentiment maintained a high rating compared to the early part of the year.
These three dimensions provide an insightful perspective into MSFT’s strong performance and positive market evaluation.
How does Microsoft Corporation (MSFT) Stack Up Against its Peers?
Other stocks in the Software - Business sector that may be worth considering are F5 Networks Inc. (FFIV), VMware Inc. (VMW), and Sapiens International Corporation N.V. (SPNS) -- they have better POWR Ratings.
What To Do Next?
Discover 10 widely held stocks that our proprietary model shows have tremendous downside potential. Please make sure none of these “death trap” stocks are lurking in your portfolio:
MSFT shares were trading at $334.65 per share on Monday afternoon, down $3.72 (-1.10%). Year-to-date, MSFT has gained 40.20%, versus a 20.37% rise in the benchmark S&P 500 index during the same period.
About the Author: Subhasree Kar

Subhasree’s keen interest in financial instruments led her to pursue a career as an investment analyst. After earning a Master’s degree in Economics, she gained knowledge of equity research and portfolio management at Finlatics.
The post Is Microsoft (MSFT) a Good Buy for August? appeared first on StockNews.com