

Cruise vacation company Royal Caribbean (NYSE: RCL) met Wall Streets revenue expectations in Q4 CY2025, with sales up 13.3% year on year to $4.26 billion. Its non-GAAP profit of $2.80 per share was in line with analysts’ consensus estimates.
Is now the time to buy Royal Caribbean? Find out by accessing our full research report, it’s free.
Royal Caribbean (RCL) Q4 CY2025 Highlights:
- Revenue: $4.26 billion vs analyst estimates of $4.26 billion (13.3% year-on-year growth, in line)
- Adjusted EPS: $2.80 vs analyst estimates of $2.80 (in line)
- Adjusted EBITDA: $1.48 billion vs analyst estimates of $1.45 billion (34.8% margin, 2.1% beat)
- Adjusted EPS guidance for the upcoming financial year 2026 is $17.90 at the midpoint, beating analyst estimates by 1.3%
- Operating Margin: 21.9%, up from 16.6% in the same quarter last year
- Free Cash Flow Margin: 2.7%, down from 24.3% in the same quarter last year
- Passenger Cruise Days: 15.12 million, up 1.44 million year on year
- Market Capitalization: $79.52 billion
"2025 was an outstanding year, and the momentum is further accelerating into 2026," said Jason Liberty, Chairman and CEO, Royal Caribbean Group.
Company Overview
Established in 1968, Royal Caribbean Cruises (NYSE: RCL) is a global cruise vacation company renowned for its innovative and exciting cruise experiences.
Revenue Growth
A company’s long-term sales performance is one signal of its overall quality. Any business can experience short-term success, but top-performing ones enjoy sustained growth for years. Luckily, Royal Caribbean’s sales grew at an impressive 52% compounded annual growth rate over the last five years. Its growth beat the average consumer discretionary company and shows its offerings resonate with customers.
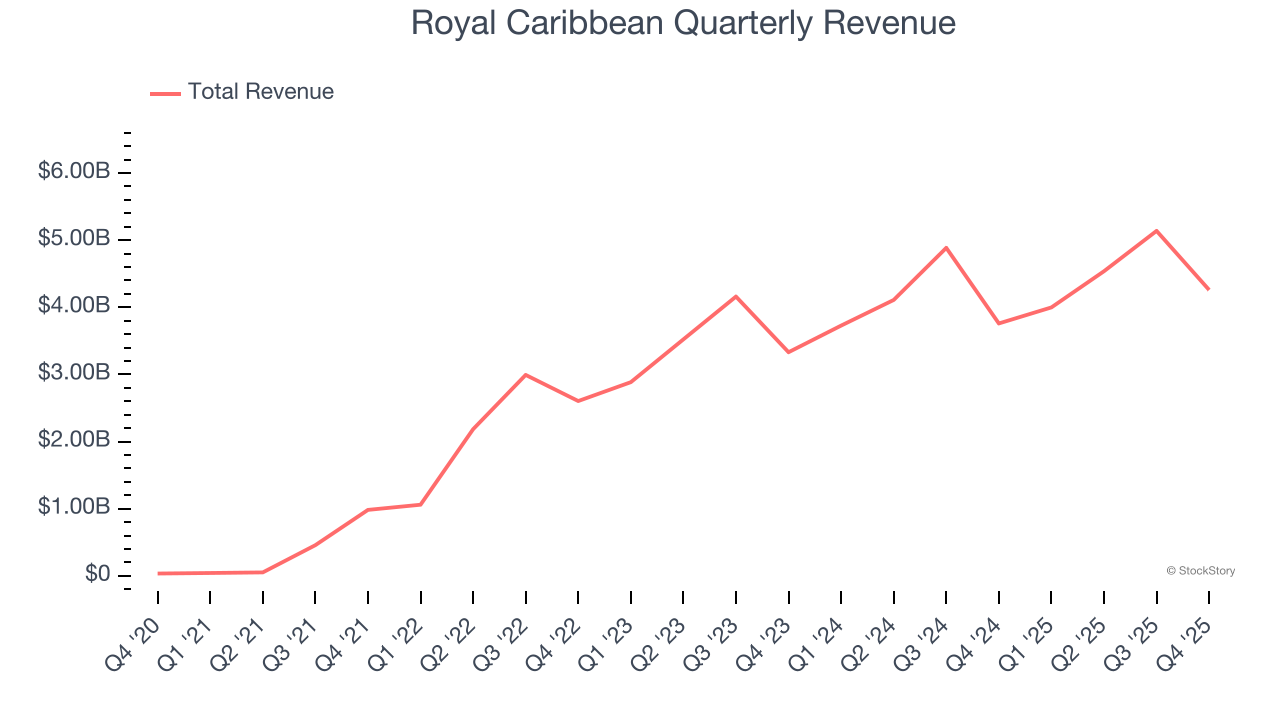
We at StockStory place the most emphasis on long-term growth, but within consumer discretionary, a stretched historical view may miss a company riding a successful new property or trend. Royal Caribbean’s recent performance shows its demand has slowed significantly as its annualized revenue growth of 13.6% over the last two years was well below its five-year trend. 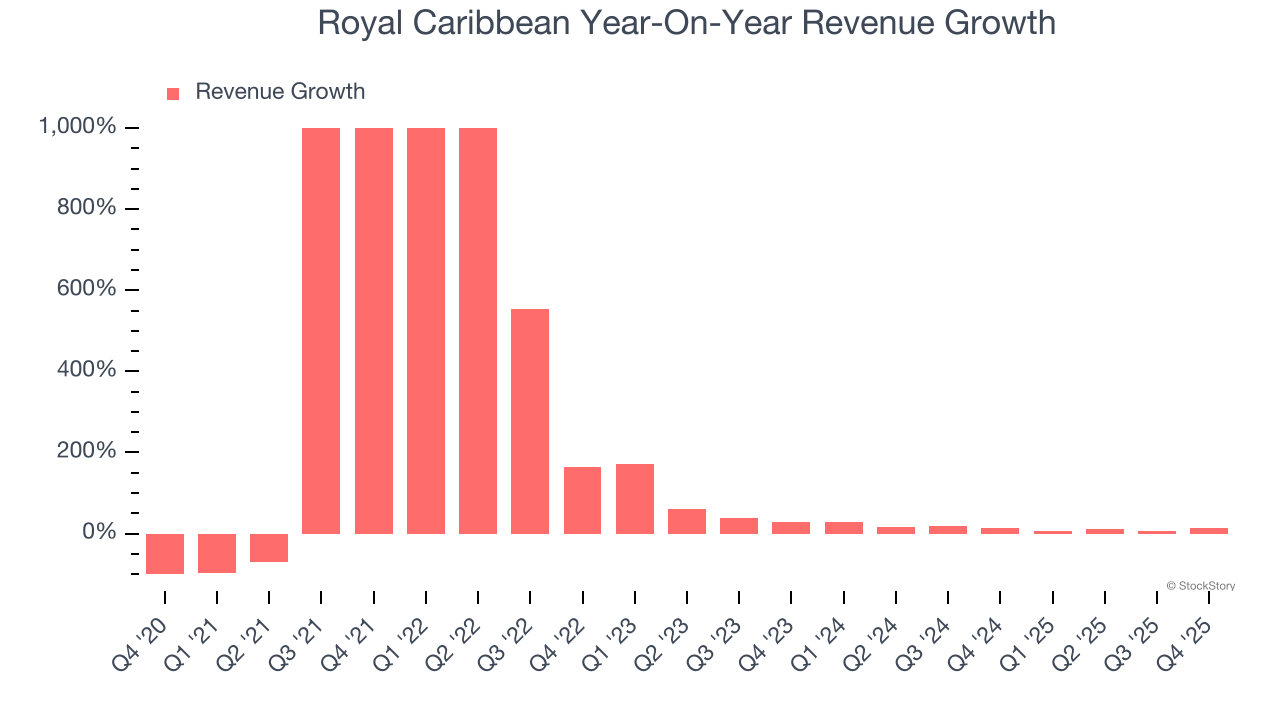
We can dig further into the company’s revenue dynamics by analyzing its number of passenger cruise days, which reached 15.12 million in the latest quarter. Over the last two years, Royal Caribbean’s passenger cruise days averaged 8.7% year-on-year growth. Because this number is lower than its revenue growth during the same period, we can see the company’s monetization has risen. 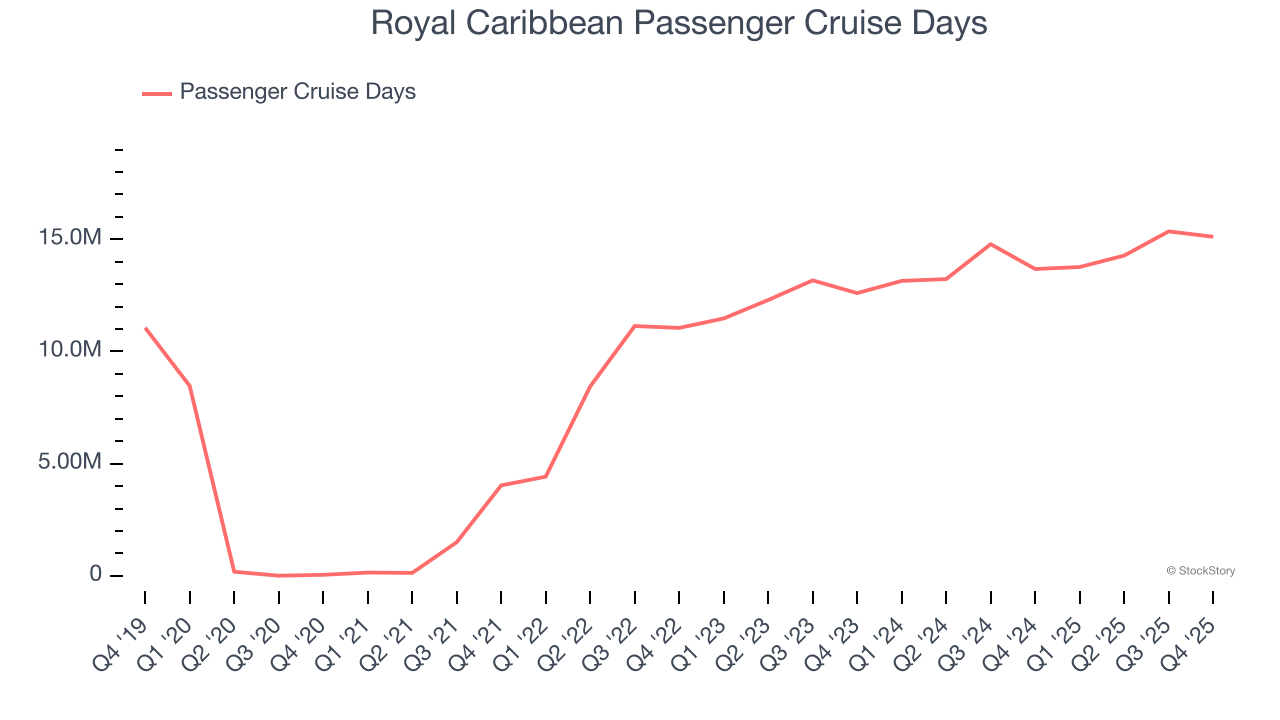
This quarter, Royal Caribbean’s year-on-year revenue growth was 13.3%, and its $4.26 billion of revenue was in line with Wall Street’s estimates.
Looking ahead, sell-side analysts expect revenue to grow 8.9% over the next 12 months, a deceleration versus the last two years. This projection doesn't excite us and indicates its products and services will see some demand headwinds.
Software is eating the world and there is virtually no industry left that has been untouched by it. That drives increasing demand for tools helping software developers do their jobs, whether it be monitoring critical cloud infrastructure, integrating audio and video functionality, or ensuring smooth content streaming. Click here to access a free report on our 3 favorite stocks to play this generational megatrend.
Operating Margin
Operating margin is a key measure of profitability. Think of it as net income - the bottom line - excluding the impact of taxes and interest on debt, which are less connected to business fundamentals.
Royal Caribbean’s operating margin has been trending up over the last 12 months and averaged 26.2% over the last two years. The company’s higher efficiency is a breath of fresh air, but its suboptimal cost structure means it still sports lousy profitability for a consumer discretionary business.
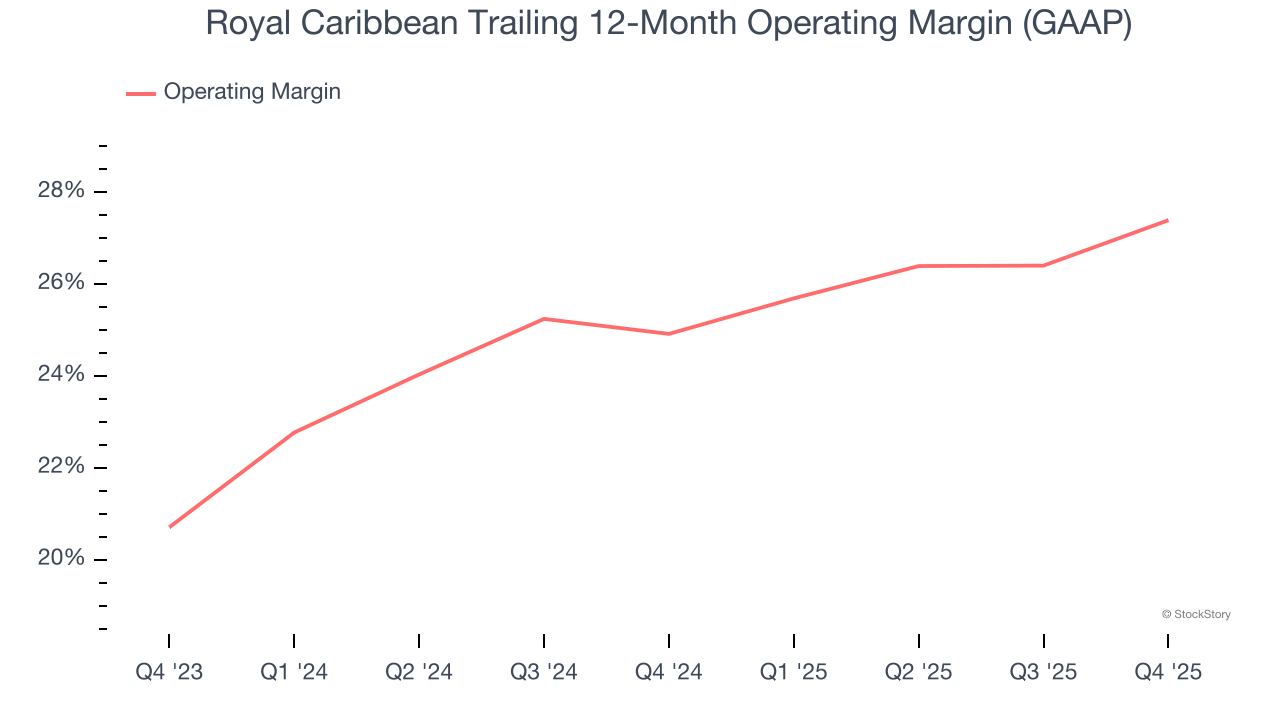
This quarter, Royal Caribbean generated an operating margin profit margin of 21.9%, up 5.3 percentage points year on year. This increase was a welcome development and shows it was more efficient.
Earnings Per Share
We track the long-term change in earnings per share (EPS) for the same reason as long-term revenue growth. Compared to revenue, however, EPS highlights whether a company’s growth is profitable.
Royal Caribbean’s full-year EPS flipped from negative to positive over the last five years. This is encouraging and shows it’s at a critical moment in its life.
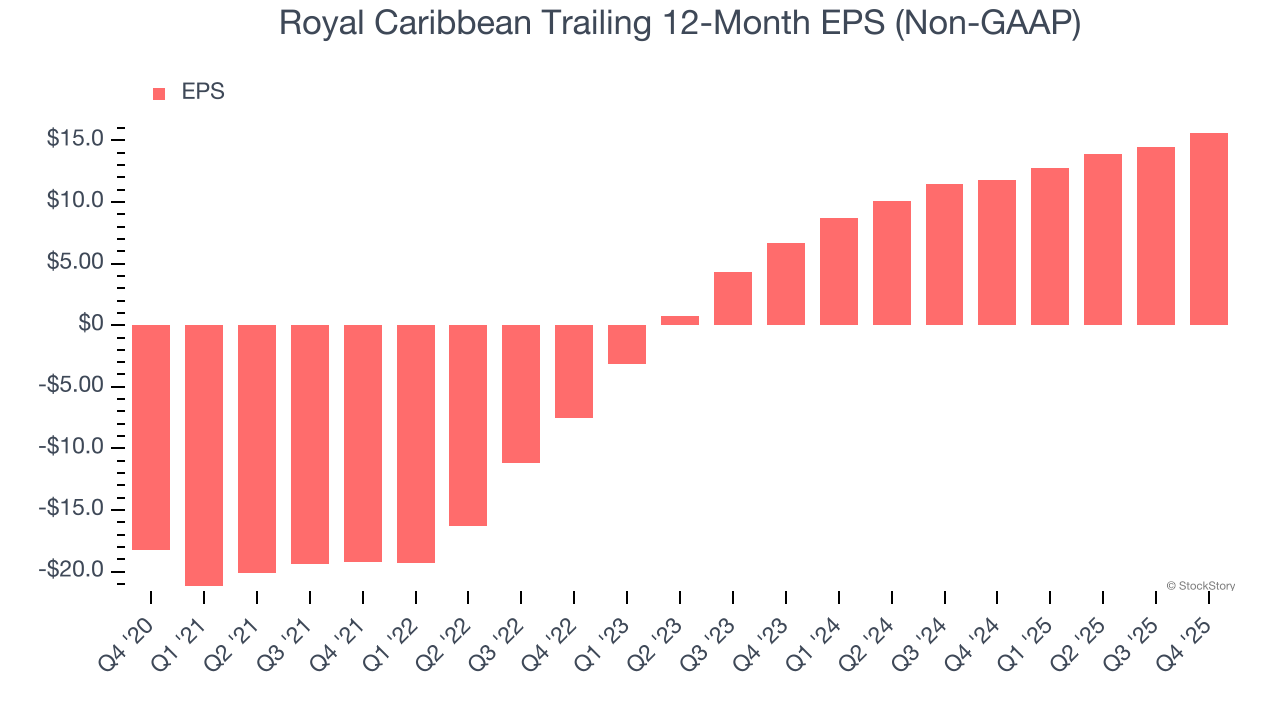
In Q4, Royal Caribbean reported adjusted EPS of $2.80, up from $1.63 in the same quarter last year. This print was close to analysts’ estimates. Over the next 12 months, Wall Street expects Royal Caribbean’s full-year EPS of $15.64 to grow 12.3%.
Key Takeaways from Royal Caribbean’s Q4 Results
We were impressed by Royal Caribbean’s optimistic EPS guidance for next quarter, which blew past analysts’ expectations. We were also glad its full-year EPS guidance slightly exceeded Wall Street’s estimates. On the other hand, its number of passenger cruise days missed. Overall, this print had some key positives. The stock traded up 6.8% to $311.44 immediately following the results.
Sure, Royal Caribbean had a solid quarter, but if we look at the bigger picture, is this stock a buy? We think that the latest quarter is only one piece of the longer-term business quality puzzle. Quality, when combined with valuation, can help determine if the stock is a buy. We cover that in our actionable full research report which you can read here (it’s free).


