

Marine transportation service company Kirby (NYSE: KEX) missed Wall Street’s revenue expectations in Q4 CY2025, but sales rose 6.2% year on year to $851.8 million. Its GAAP profit of $1.68 per share was 3.4% above analysts’ consensus estimates.
Is now the time to buy Kirby? Find out by accessing our full research report, it’s free.
Kirby (KEX) Q4 CY2025 Highlights:
- Revenue: $851.8 million vs analyst estimates of $863.8 million (6.2% year-on-year growth, 1.4% miss)
- EPS (GAAP): $1.68 vs analyst estimates of $1.63 (3.4% beat)
- Adjusted EBITDA: $203.1 million vs analyst estimates of $191.8 million (23.8% margin, 5.9% beat)
- Operating Margin: 15.2%, up from 6.3% in the same quarter last year
- Free Cash Flow Margin: 31.1%, up from 18.8% in the same quarter last year
- Market Capitalization: $6.94 billion
David Grzebinski, Kirby’s Chief Executive Officer, commented, “2025 was a record year for Kirby capped off by a solid final quarter. During the fourth quarter, we navigated typical seasonal weather and year‑end softness, with exceptional execution by both our Marine Transportation and Distribution & Services teams. Earnings per share and free cash flow grew meaningfully, and we closed the year with strong momentum. Looking ahead, we expect sustained growth and solid performance as we move into 2026.”
Company Overview
Transporting goods along all U.S. coasts, Kirby (NYSE: KEX) provides inland and coastal marine transportation services.
Revenue Growth
A company’s long-term sales performance can indicate its overall quality. Any business can experience short-term success, but top-performing ones enjoy sustained growth for years. Luckily, Kirby’s sales grew at a solid 9.2% compounded annual growth rate over the last five years. Its growth beat the average industrials company and shows its offerings resonate with customers.
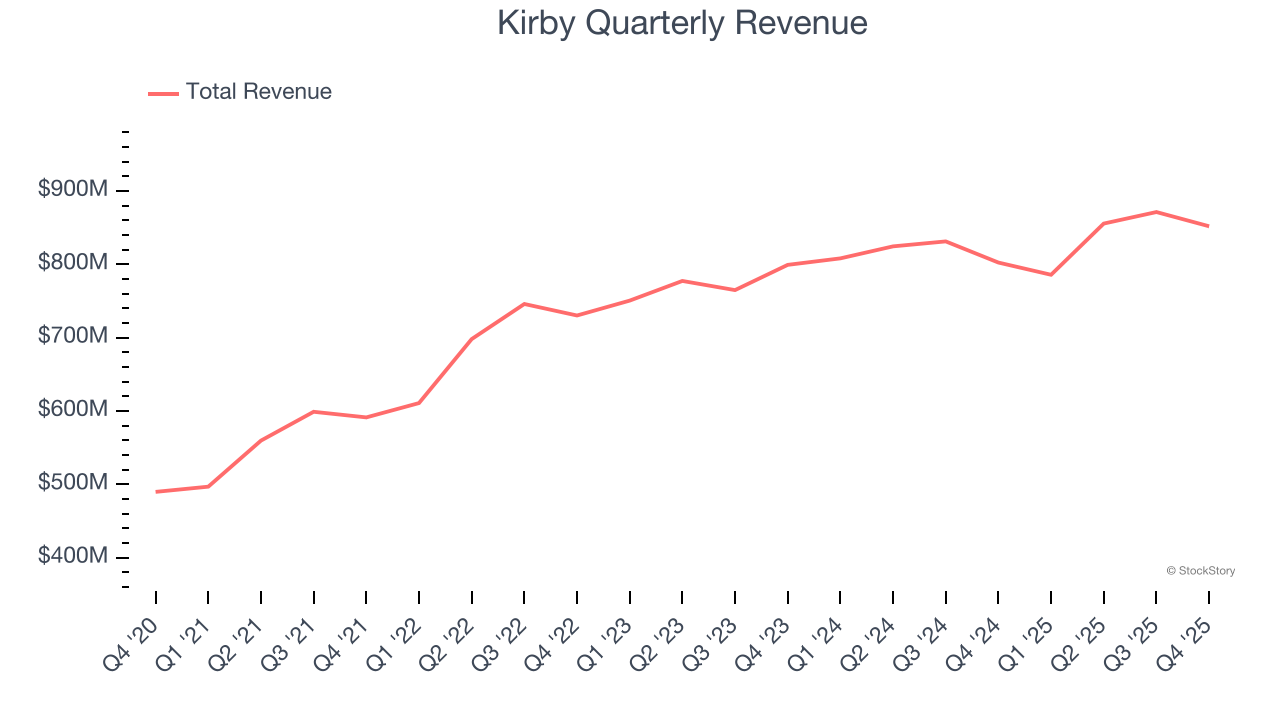
Long-term growth is the most important, but within industrials, a half-decade historical view may miss new industry trends or demand cycles. Kirby’s recent performance shows its demand has slowed as its annualized revenue growth of 4.3% over the last two years was below its five-year trend. We also note many other Marine Transportation businesses have faced declining sales because of cyclical headwinds. While Kirby grew slower than we’d like, it did do better than its peers. 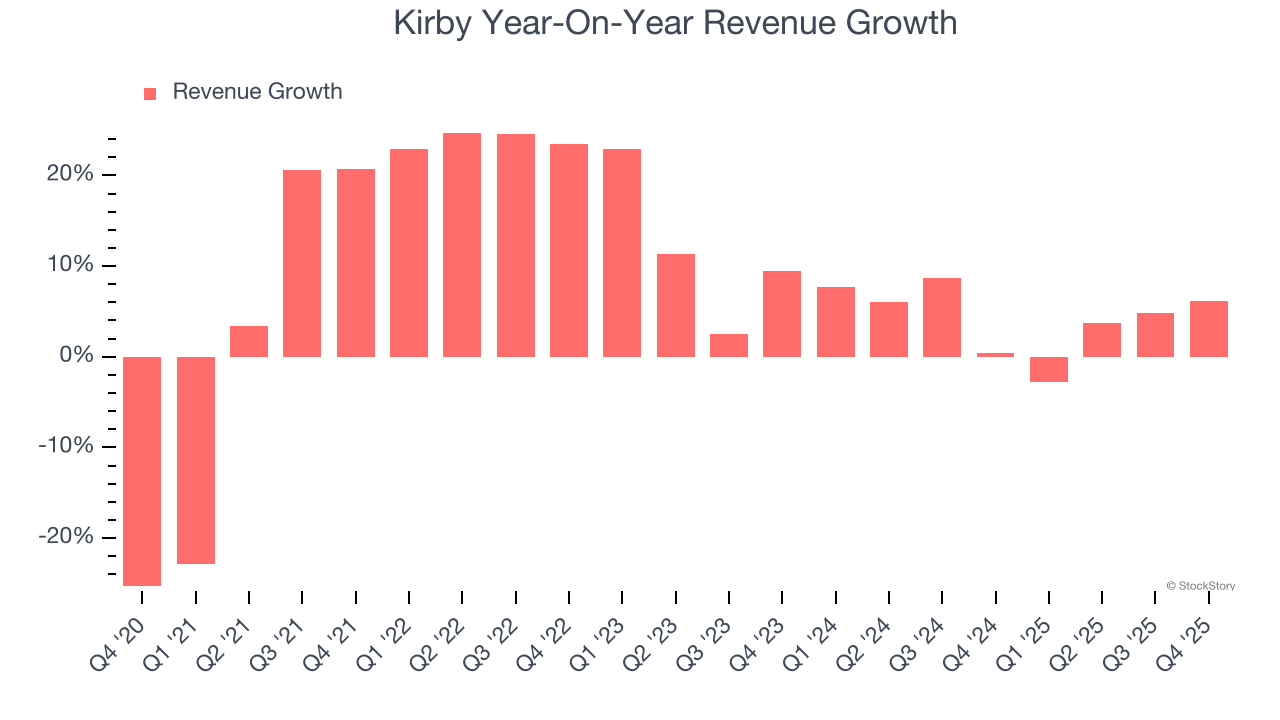
We can better understand the company’s revenue dynamics by analyzing its most important segments, Marine Transportation and Distribution and Services, which are 56.5% and 43.5% of revenue. Over the last two years, Kirby’s Marine Transportation revenue (petroleum products and chemicals) averaged 6.2% year-on-year growth while its Distribution and Services revenue (aftermarket parts and equipment) averaged 2.2% growth. 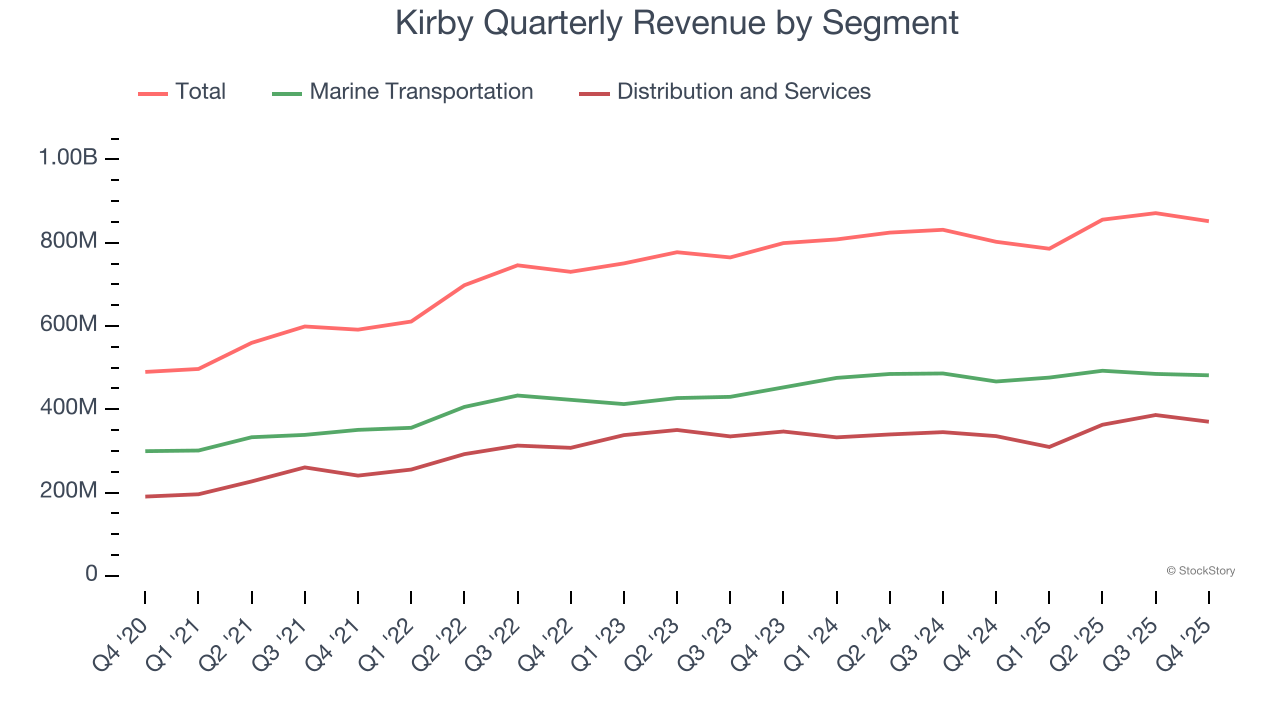
This quarter, Kirby’s revenue grew by 6.2% year on year to $851.8 million, missing Wall Street’s estimates.
Looking ahead, sell-side analysts expect revenue to grow 5.4% over the next 12 months, similar to its two-year rate. While this projection implies its newer products and services will spur better top-line performance, it is still below the sector average.
Software is eating the world and there is virtually no industry left that has been untouched by it. That drives increasing demand for tools helping software developers do their jobs, whether it be monitoring critical cloud infrastructure, integrating audio and video functionality, or ensuring smooth content streaming. Click here to access a free report on our 3 favorite stocks to play this generational megatrend.
Operating Margin
Operating margin is one of the best measures of profitability because it tells us how much money a company takes home after procuring and manufacturing its products, marketing and selling those products, and most importantly, keeping them relevant through research and development.
Kirby was profitable over the last five years but held back by its large cost base. Its average operating margin of 7.9% was weak for an industrials business. This result isn’t too surprising given its low gross margin as a starting point.
On the plus side, Kirby’s operating margin rose by 26.2 percentage points over the last five years, as its sales growth gave it immense operating leverage. We’ll take Kirby’s improvement as many Marine Transportation companies saw their margins fall (along with revenue, as mentioned above) because the cycle turned in the wrong direction.
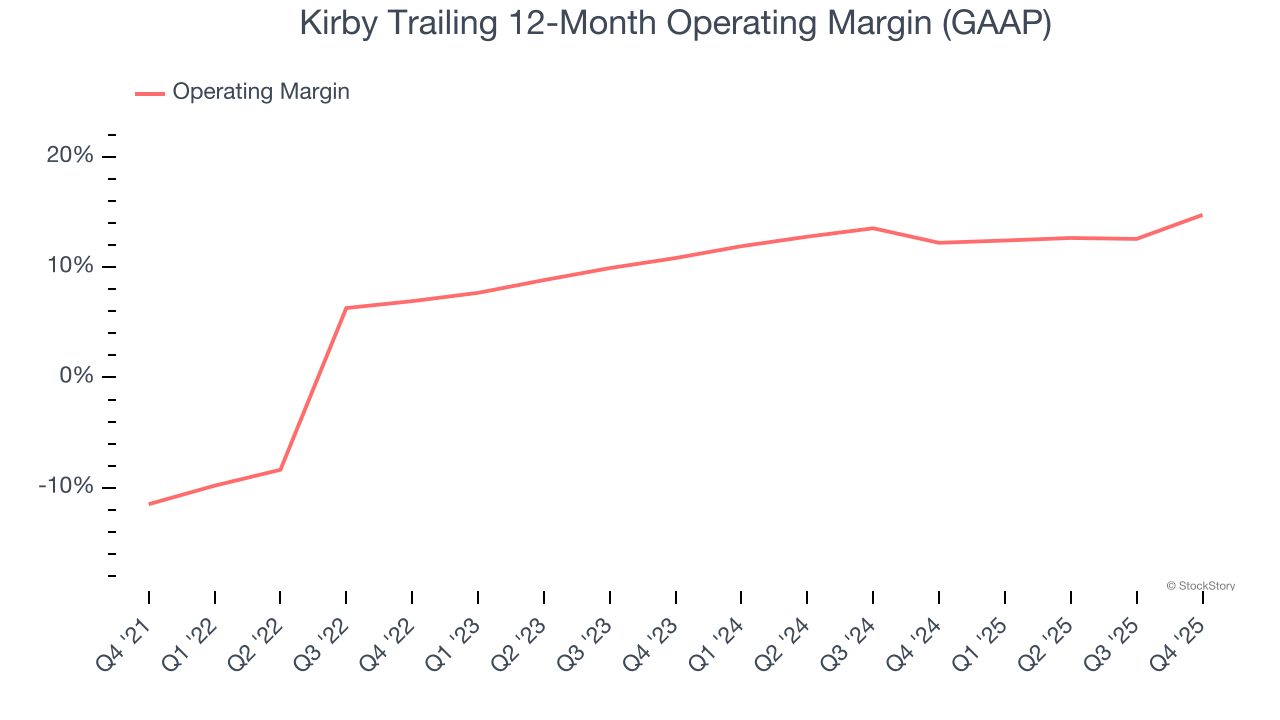
In Q4, Kirby generated an operating margin profit margin of 15.2%, up 9 percentage points year on year. The increase was solid, and because its operating margin rose more than its gross margin, we can infer it was more efficient with expenses such as marketing, R&D, and administrative overhead.
Earnings Per Share
Revenue trends explain a company’s historical growth, but the long-term change in earnings per share (EPS) points to the profitability of that growth – for example, a company could inflate its sales through excessive spending on advertising and promotions.
Kirby’s full-year EPS flipped from negative to positive over the last five years. This is a good sign and shows it’s at an inflection point.
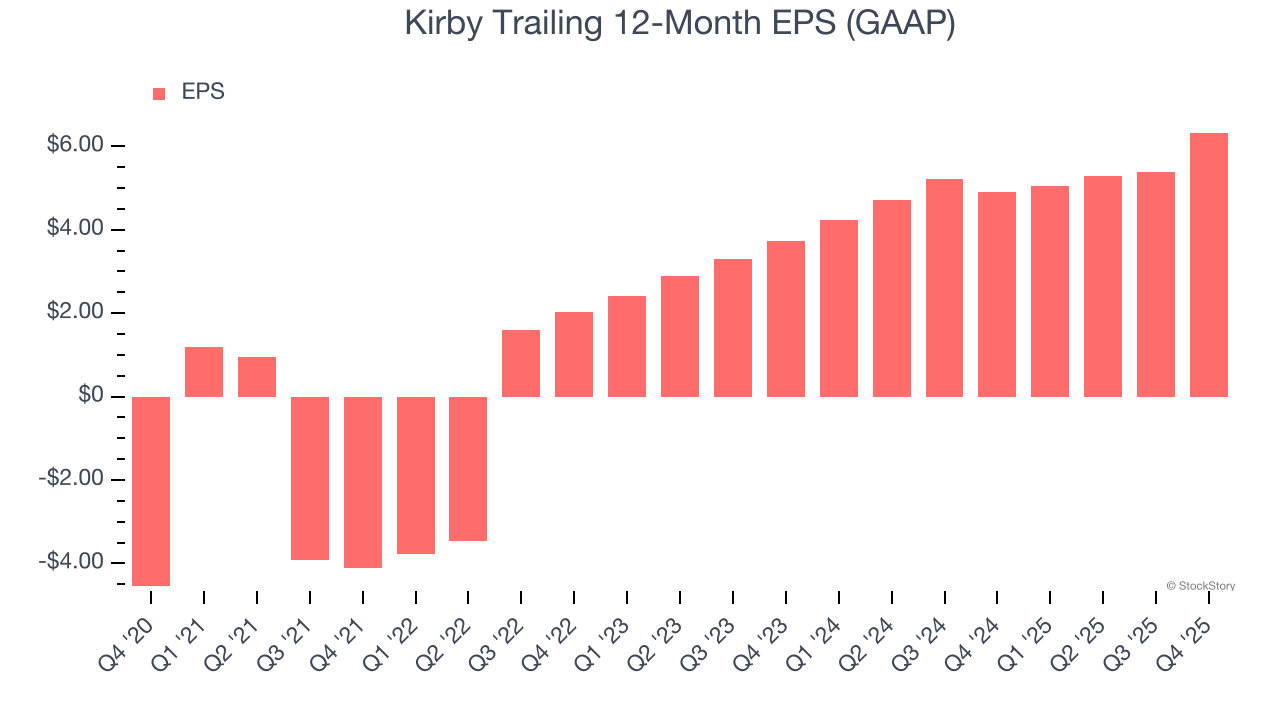
Like with revenue, we analyze EPS over a more recent period because it can provide insight into an emerging theme or development for the business.
Kirby’s EPS grew at an astounding 30.3% compounded annual growth rate over the last two years, higher than its 4.3% annualized revenue growth. This tells us the company became more profitable on a per-share basis as it expanded.
Diving into Kirby’s quality of earnings can give us a better understanding of its performance. Kirby’s operating margin has expanded over the last two yearswhile its share count has shrunk 8.1%. These are positive signs for shareholders because improving profitability and share buybacks turbocharge EPS growth relative to revenue growth. 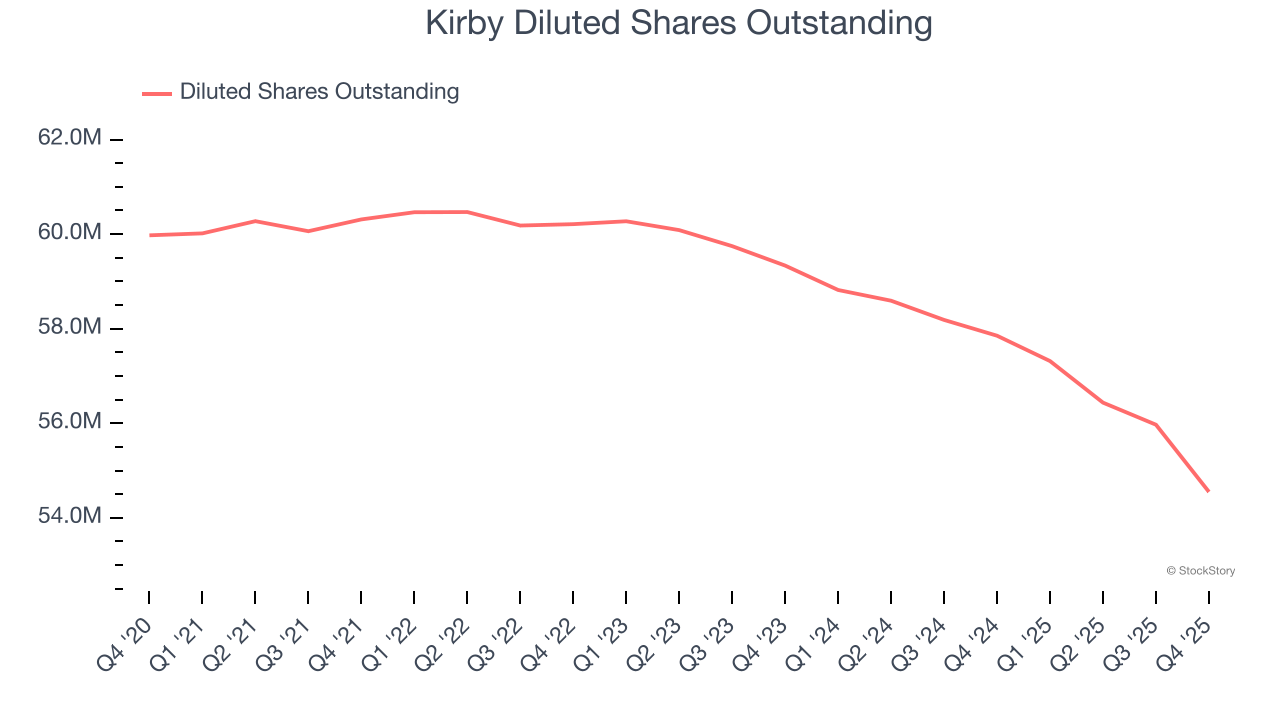
In Q4, Kirby reported EPS of $1.68, up from $0.74 in the same quarter last year. This print beat analysts’ estimates by 3.4%. Over the next 12 months, Wall Street expects Kirby’s full-year EPS of $6.33 to grow 10.9%.
Key Takeaways from Kirby’s Q4 Results
We enjoyed seeing Kirby beat analysts’ EBITDA expectations this quarter. We were also glad its EPS outperformed Wall Street’s estimates. On the other hand, its revenue slightly missed and its Marine Transportation revenue fell short of Wall Street’s estimates. Zooming out, we think this was a mixed quarter. Investors were likely hoping for more, and shares traded down 4.1% to $122.85 immediately after reporting.
Should you buy the stock or not? When making that decision, it’s important to consider its valuation, business qualities, as well as what has happened in the latest quarter. We cover that in our actionable full research report which you can read here (it’s free).


