

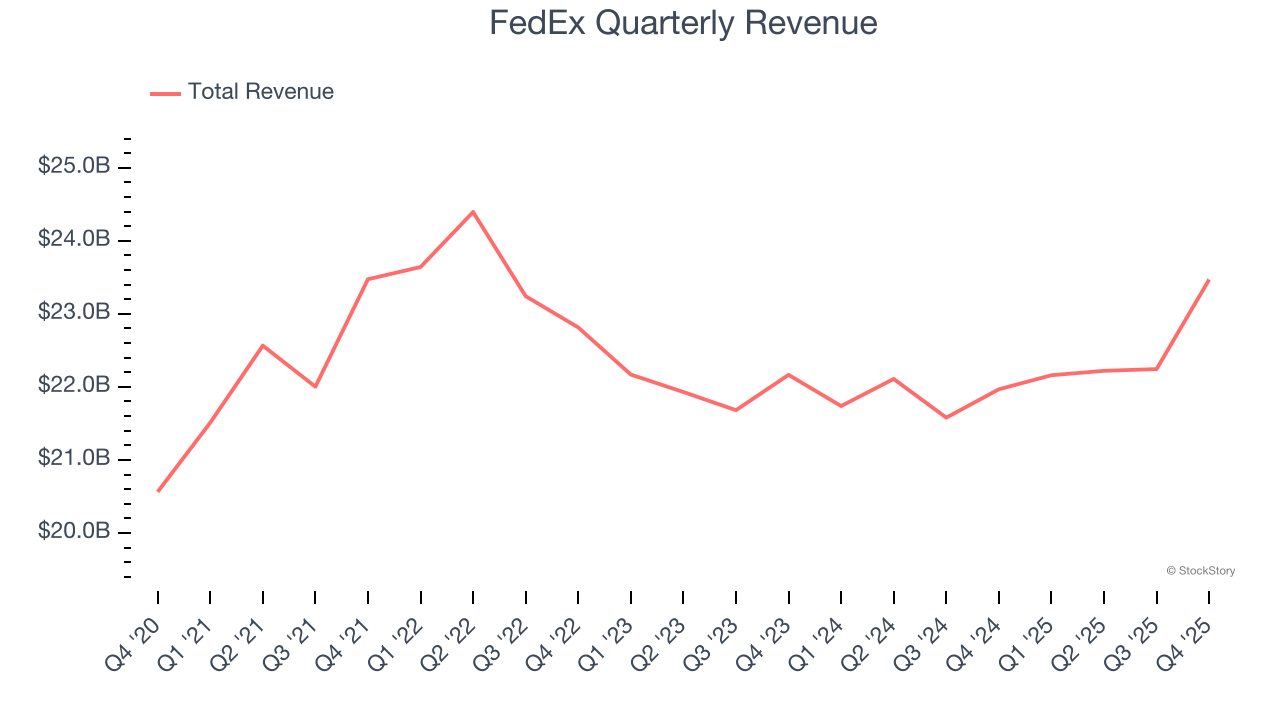
Parcel and cargo delivery company FedEx (NYSE: FDX) reported Q4 CY2025 results topping the market’s revenue expectations, with sales up 6.8% year on year to $23.47 billion. Its non-GAAP profit of $4.82 per share was 17.2% above analysts’ consensus estimates.
Is now the time to buy FedEx? Find out by accessing our full research report, it’s free for active Edge members.
FedEx (FDX) Q4 CY2025 Highlights:
- Revenue: $23.47 billion vs analyst estimates of $22.79 billion (6.8% year-on-year growth, 3% beat)
- Adjusted EPS: $4.82 vs analyst estimates of $4.11 (17.2% beat)
- Management raised its full-year Adjusted EPS guidance to $18.40 at the midpoint, a 1.7% increase
- Operating Margin: 5.9%, up from 4.8% in the same quarter last year
- Free Cash Flow Margin: 6.5%, up from 0.8% in the same quarter last year
- Market Capitalization: $66.59 billion
Company Overview
Sporting one of the largest air cargo fleets in the world, FedEx (NYSE: FDX) is a global provider of parcel and cargo delivery services.
Revenue Growth
A company’s long-term performance is an indicator of its overall quality. Even a bad business can shine for one or two quarters, but a top-tier one grows for years. Regrettably, FedEx’s sales grew at a sluggish 3.8% compounded annual growth rate over the last five years. This fell short of our benchmark for the industrials sector and is a poor baseline for our analysis.
Long-term growth is the most important, but within industrials, a half-decade historical view may miss new industry trends or demand cycles. FedEx’s recent performance shows its demand has slowed as its annualized revenue growth of 1.2% over the last two years was below its five-year trend. We also note many other Air Freight and Logistics businesses have faced declining sales because of cyclical headwinds. While FedEx grew slower than we’d like, it did do better than its peers. 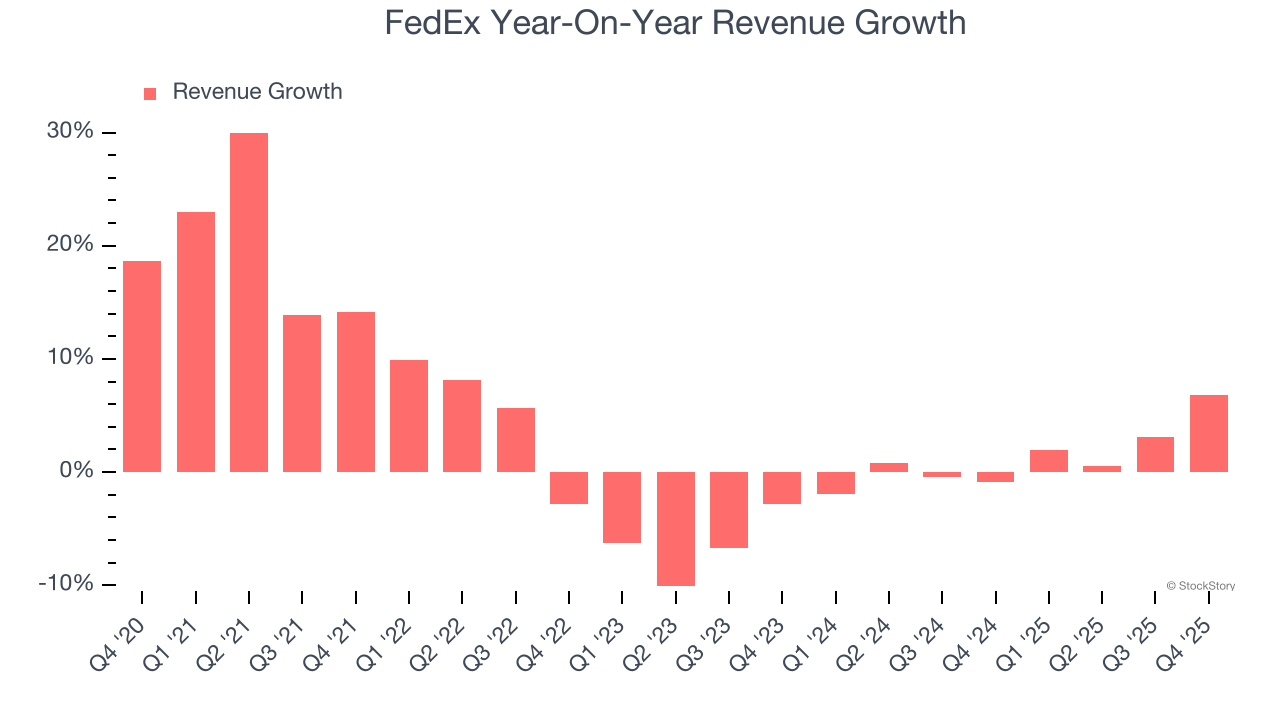
This quarter, FedEx reported year-on-year revenue growth of 6.8%, and its $23.47 billion of revenue exceeded Wall Street’s estimates by 3%.
Looking ahead, sell-side analysts expect revenue to grow 3.9% over the next 12 months. While this projection implies its newer products and services will fuel better top-line performance, it is still below average for the sector.
While Wall Street chases Nvidia at all-time highs, an under-the-radar semiconductor supplier is dominating a critical AI component these giants can’t build without. Click here to access our free report one of our favorites growth stories.
Operating Margin
Operating margin is one of the best measures of profitability because it tells us how much money a company takes home after procuring and manufacturing its products, marketing and selling those products, and most importantly, keeping them relevant through research and development.
FedEx’s operating margin might fluctuated slightly over the last 12 months but has remained more or less the same, averaging 6.1% over the last five years. This profitability was paltry for an industrials business and caused by its suboptimal cost structureand low gross margin.
Looking at the trend in its profitability, FedEx’s operating margin might fluctuated slightly but has generally stayed the same over the last five years. This raises questions about the company’s expense base because its revenue growth should have given it leverage on its fixed costs, resulting in better economies of scale and profitability. FedEx’s performance was poor, but we noticed this is a broad theme as many similar Air Freight and Logistics companies saw their margins fall (along with revenue, as mentioned above) because the cycle turned in the wrong direction.
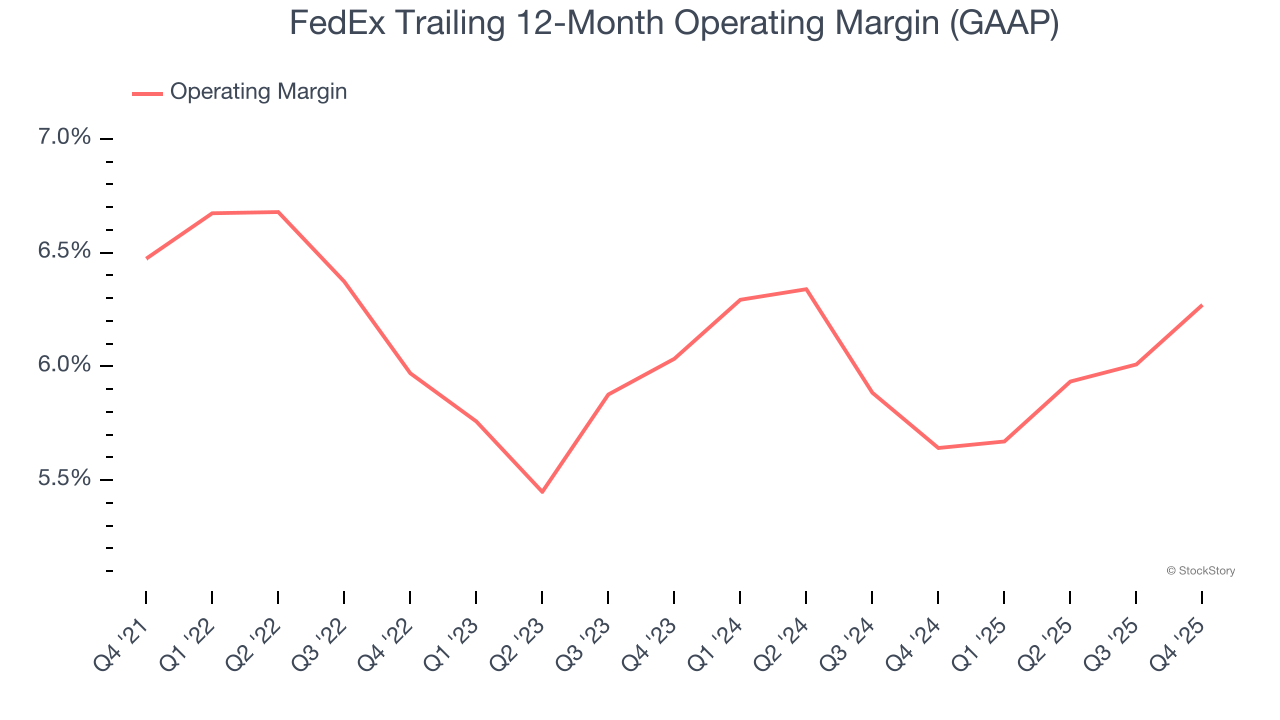
In Q4, FedEx generated an operating margin profit margin of 5.9%, up 1.1 percentage points year on year. Since its gross margin expanded more than its operating margin, we can infer that leverage on its cost of sales was the primary driver behind the recently higher efficiency.
Earnings Per Share
Revenue trends explain a company’s historical growth, but the long-term change in earnings per share (EPS) points to the profitability of that growth – for example, a company could inflate its sales through excessive spending on advertising and promotions.
FedEx’s EPS grew at an unimpressive 7.1% compounded annual growth rate over the last five years. This performance was better than its flat revenue but doesn’t tell us much about its business quality because its operating margin didn’t improve.
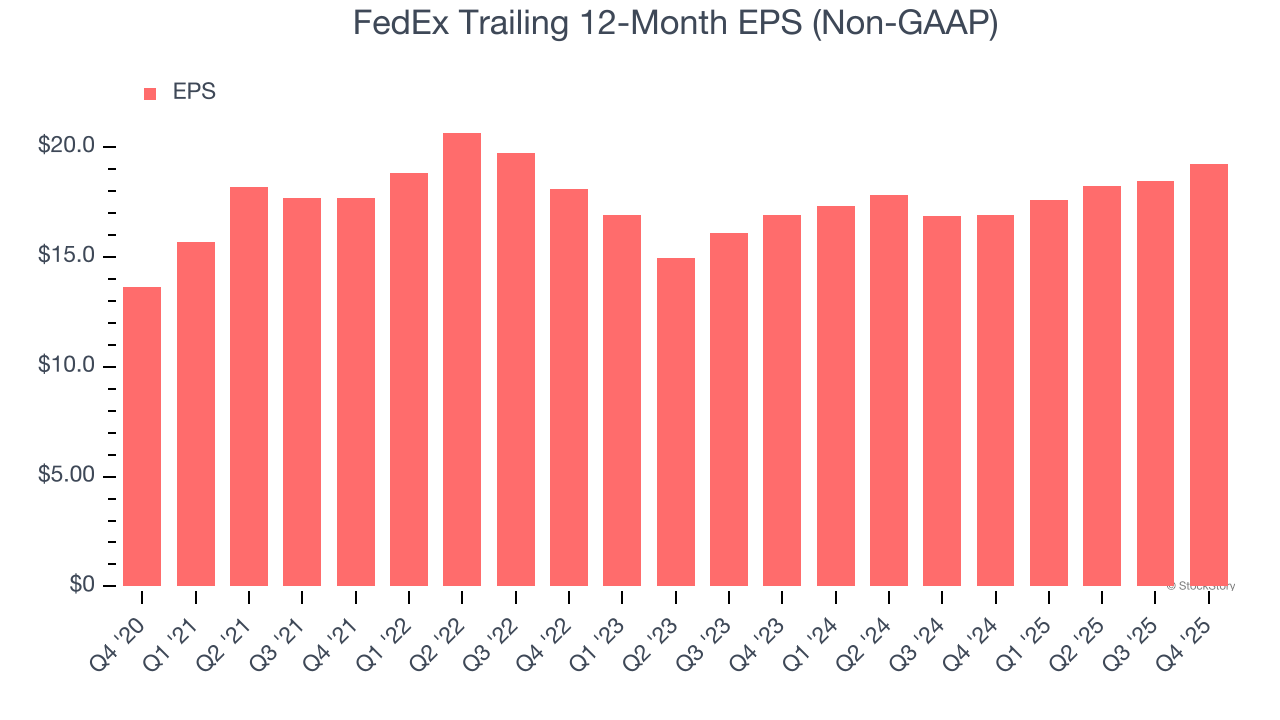
Diving into the nuances of FedEx’s earnings can give us a better understanding of its performance. A five-year view shows that FedEx has repurchased its stock, shrinking its share count by 12.3%. This tells us its EPS outperformed its revenue not because of increased operational efficiency but financial engineering, as buybacks boost per share earnings. 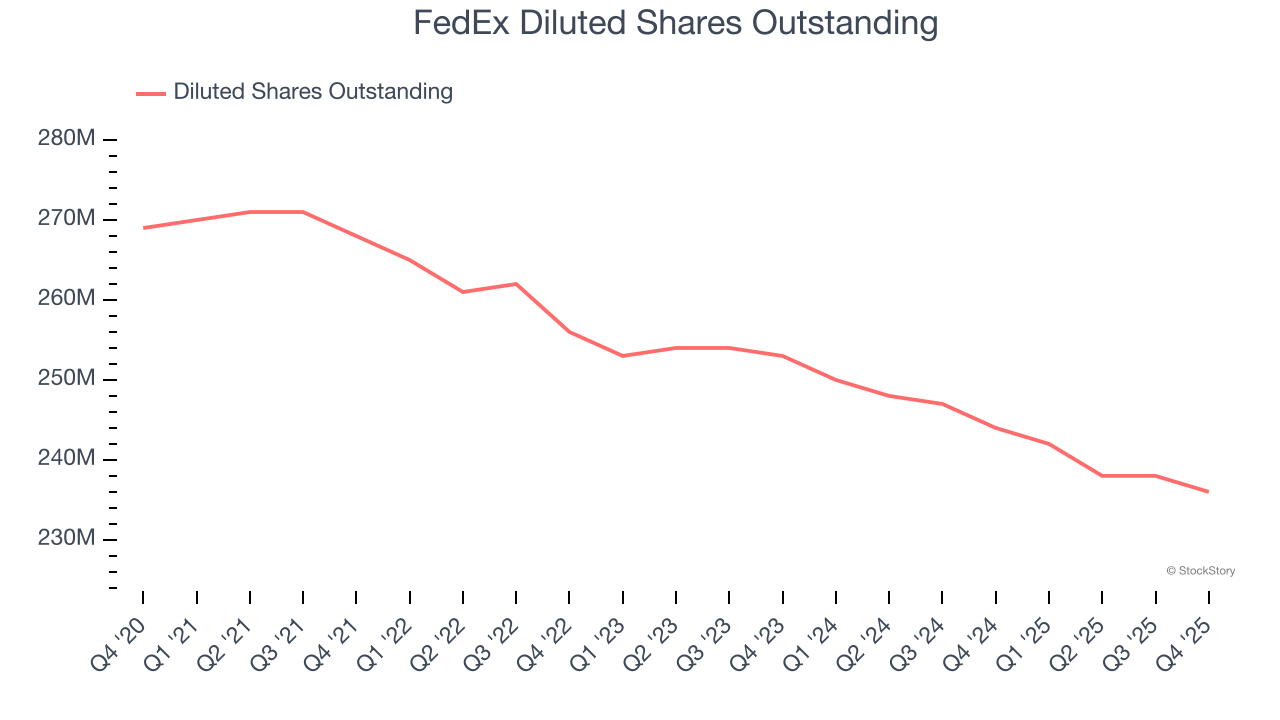
Like with revenue, we analyze EPS over a more recent period because it can provide insight into an emerging theme or development for the business.
For FedEx, its two-year annual EPS growth of 6.7% is similar to its five-year trend, implying stable earnings.
In Q4, FedEx reported adjusted EPS of $4.82, up from $4.05 in the same quarter last year. This print easily cleared analysts’ estimates, and shareholders should be content with the results. Over the next 12 months, Wall Street expects FedEx’s full-year EPS of $19.23 to grow 1.8%.
Key Takeaways from FedEx’s Q4 Results
We enjoyed seeing FedEx beat analysts’ revenue expectations this quarter. We were also glad its EPS outperformed Wall Street’s estimates. Looking ahead, full-year EPS guidance was also raised. Overall, we think this was a solid quarter with some key metrics above expectations. The stock traded up 1.7% to $292.91 immediately following the results.
Indeed, FedEx had a rock-solid quarterly earnings result, but is this stock a good investment here? If you’re making that decision, you should consider the bigger picture of valuation, business qualities, as well as the latest earnings. We cover that in our actionable full research report which you can read here, it’s free for active Edge members.


