After the bell today, Coinbase reported another period of impressive results in its second quarter earnings report.
During the quarter, Coinbase’s total revenue reached $2.23 billion, which helped the company generate net income of $1.61 billion in the three-month period. The company benefited from a one-time line item worth $737.5 million, which stemmed from what Coinbase described as a “tax benefit” from its direct listing earlier the quarter.
This puts us in the odd position of leaning more heavily on the company’s adjusted EBITDA metric, a figure that we usually discount, rather than the stricter net income result. This quarter the adjusted metric is actually a bit clearer regarding the company’s regular profitability. Coinbase posted adjusted EBITDA of $1.1 billion in the period.
The company easily bested expectations, with the market expecting revenues of just $1.85 billion, and adjusted EBITDA of $961.5 million, per Yahoo Finance.
All that’s well and good, but the company provided a fascinating set of data for us to peruse that may help us better understand where the crypto economy stands today. Let’s get into the details.
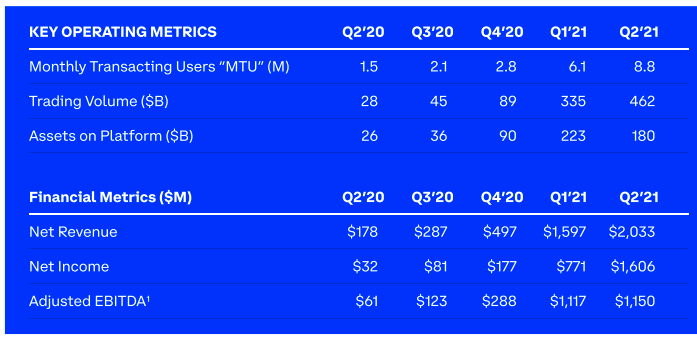
Trading volumeThere are two datasets from Coinbase’s Q2 that we need. The first deals with monthly transacting users, and overall trading volume:

Seeing Coinbase continue to add MTUs in the second quarter was impressive, as was the company’s Q2 trading volume result in light of the falling platform asset figure. Quite simply, Coinbase managed to accrete trading volume despite generally falling crypto prices over the time period in question.
Or as the company put it, “[d]espite price movements, we saw billions of dollars of net asset
inflows and new customers added throughout Q2.”
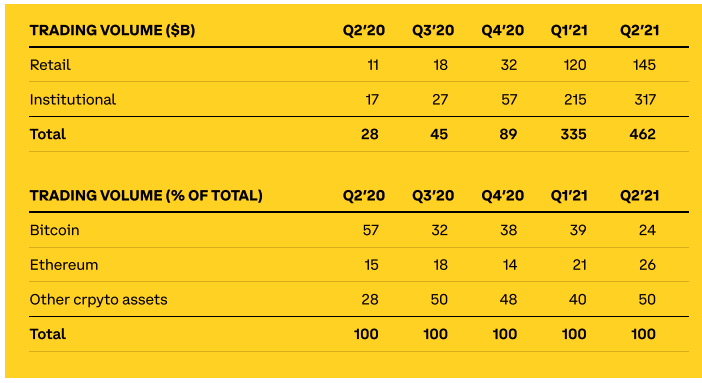
The next dataset deals with a breakdown of trading volume by source, and type:

The incremental growth in retail volume from Q1 2021 to Q2 2021 is impressive for a single quarter, frankly, but the pace at which Coinbase added institutional volume in the quarter is even stronger. It’s a huge result.
For the more crypto-focused than financials-focused out there, the second set of numbers is even more notable. Ethereum trading volume beat bitcoin trading volume, while “other” was more than twice what bitcoin itself managed.
A changing of the guard? The company listed three reasons for why this happened, the second of which is the most interesting. Per the earnings report:
[The mix shift was driven by] meaningful growth in Ethereum trading volumes, surpassing Bitcoin trading volumes on Coinbase for the first time driven by growth in the DeFi and NFT ecosystems (where Ethereum is an important underlying blockchain), and increased demand driven by our ETH2 staking product.
Basically, the neat stuff that the Ethereum blockchain enables is driving volume in its underlying coin, ether. Bitcoin may be the oldest crypto, but its crown may be starting to rust. Bitcoin remains the largest asset on Coinbase, at 47 percent, however.
Now let’s talk revenues.
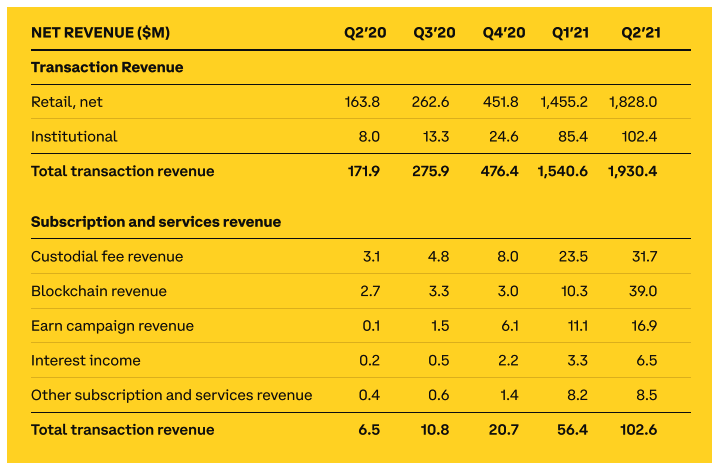
Top lineWhile institutional trading volume was an impressive source of growth for Coinbase, the company’s revenue breakdown remained retail-heavy. Here’s the data:

The transaction revenue growth from Q1 to Q2 speaks for itself, and was a key driver of the company’s strong second-quarter aggregate results. But perhaps more notable was the huge differential in subscription and services revenue at the company, growing nearly 100 percent from $56.4 million in Q1 2021 to $102.6 million in the most recent period.
Certainly, Coinbase remains a transaction-led company, but in revenue terms, its third line-item is becoming material.
Now, the somewhat bad news.
What about Q3 2021?Let’s start with how Coinbase describes the start to its third quarter:
In July, retail MTUs and total Trading Volume were 6.3 million and $57.0 billion, respectively, as crypto asset prices and crypto asset volatility declined significantly relative to Q2 levels. August month-to-date, retail MTUs and Trading Volume levels have slightly improved compared to July levels but remain lower than earlier in the year. As a result, we believe retail MTUs and total Trading Volume will be lower in Q3 as compared to Q2.
In contrast, Q2 MTUs were 8.8 million and total trading volume, pro-rated for each month of the quarter, came to $154 billion. Therefore, Coinbase had a far smaller July than what it managed on a monthly basis in Q2. That August is trending better than July is a small consolation, but it does appear that Coinbase will be a smaller business in Q3 than it was in Q1 or Q2.
If you were curious why Coinbase’s stock is not flying in the wake of its strong Q2 results, this is likely why. Of course, any serious investor in a crypto exchange is aware of how variable results can be in the sector. So a decrease after a few periods of strong results is not a huge lump to swallow.
Coinbase is worth $267.55 per share in after-hours trading as of the time of writing, off around three-quarters of a percent. That’s not even a haircut.
All told, Coinbase’s second quarter was excellent.

