Precision motion systems specialist Allient (NASDAQ: ALNT) reported Q4 CY2025 results beating Wall Street’s revenue expectations, with sales up 17.5% year on year to $143.4 million. Its non-GAAP profit of $0.55 per share was 23.3% above analysts’ consensus estimates.
Is now the time to buy Allient? Find out by accessing our full research report, it’s free.
Allient (ALNT) Q4 CY2025 Highlights:
- Revenue: $143.4 million vs analyst estimates of $133.3 million (17.5% year-on-year growth, 7.5% beat)
- Adjusted EPS: $0.55 vs analyst estimates of $0.45 (23.3% beat)
- Adjusted EBITDA: $19.03 million vs analyst estimates of $16.19 million (13.3% margin, 17.5% beat)
- Operating Margin: 7.9%, up from 3.5% in the same quarter last year
- Free Cash Flow Margin: 8.1%, similar to the same quarter last year
- Backlog: $232.9 million at quarter end
- Market Capitalization: $1.08 billion
“2025 was an important year for Allient as we delivered strong performance in the fourth quarter and meaningful improvement across key financial metrics for the full year,” commented Dick Warzala, Chairman and CEO.
Company Overview
Founded in 1962, Allient (NASDAQ: ALNT) develops and manufactures precision and specialty-controlled motion components and systems.
Revenue Growth
Reviewing a company’s long-term sales performance reveals insights into its quality. Any business can put up a good quarter or two, but many enduring ones grow for years. Over the last five years, Allient grew its sales at a decent 8.6% compounded annual growth rate. Its growth was slightly above the average industrials company and shows its offerings resonate with customers.
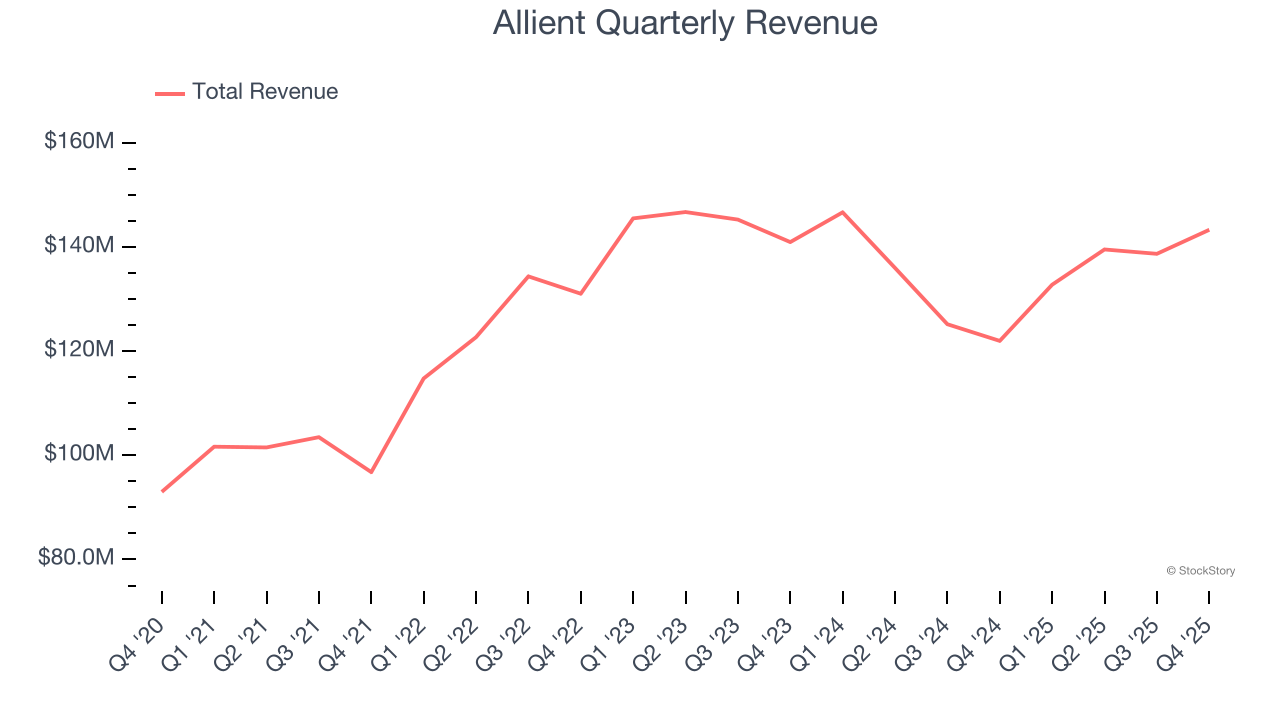
Long-term growth is the most important, but within industrials, a half-decade historical view may miss new industry trends or demand cycles. Allient’s recent performance marks a sharp pivot from its five-year trend as its revenue has shown annualized declines of 2.1% over the last two years. 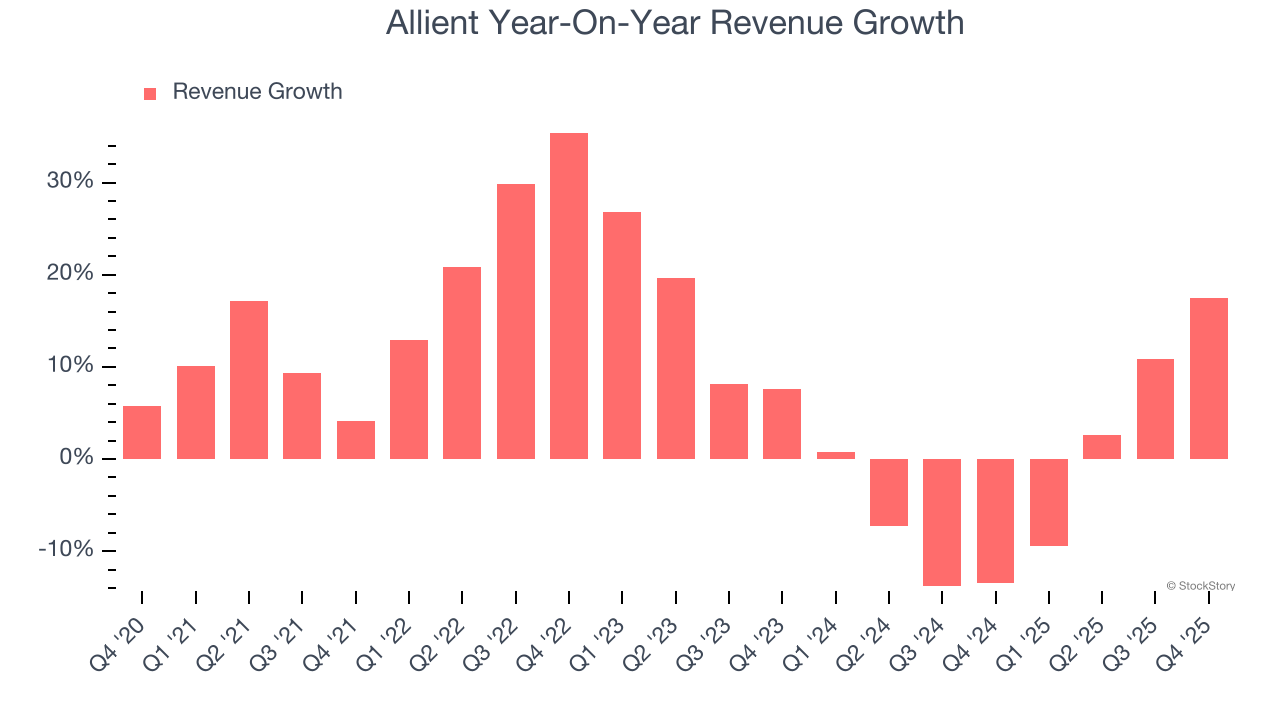
This quarter, Allient reported year-on-year revenue growth of 17.5%, and its $143.4 million of revenue exceeded Wall Street’s estimates by 7.5%.
Looking ahead, sell-side analysts expect revenue to grow 3.4% over the next 12 months. Although this projection implies its newer products and services will catalyze better top-line performance, it is still below average for the sector.
WHILE YOU’RE HERE: The Next Palantir? One satellite company captures images of every point on Earth. Every single day. The Pentagon wants it. Hedge funds are using it to beat earnings. You’ve probably never heard of it.
This is what the early days of Palantir looked like before it became a $437 billion giant. Same playbook. Different technology. If you missed Palantir, you need to see this. Claim The Stock Ticker for Free HERE.
Operating Margin
Operating margin is one of the best measures of profitability because it tells us how much money a company takes home after procuring and manufacturing its products, marketing and selling those products, and most importantly, keeping them relevant through research and development.
Allient was profitable over the last five years but held back by its large cost base. Its average operating margin of 7% was weak for an industrials business.
On the plus side, Allient’s operating margin rose by 1.7 percentage points over the last five years, as its sales growth gave it operating leverage.
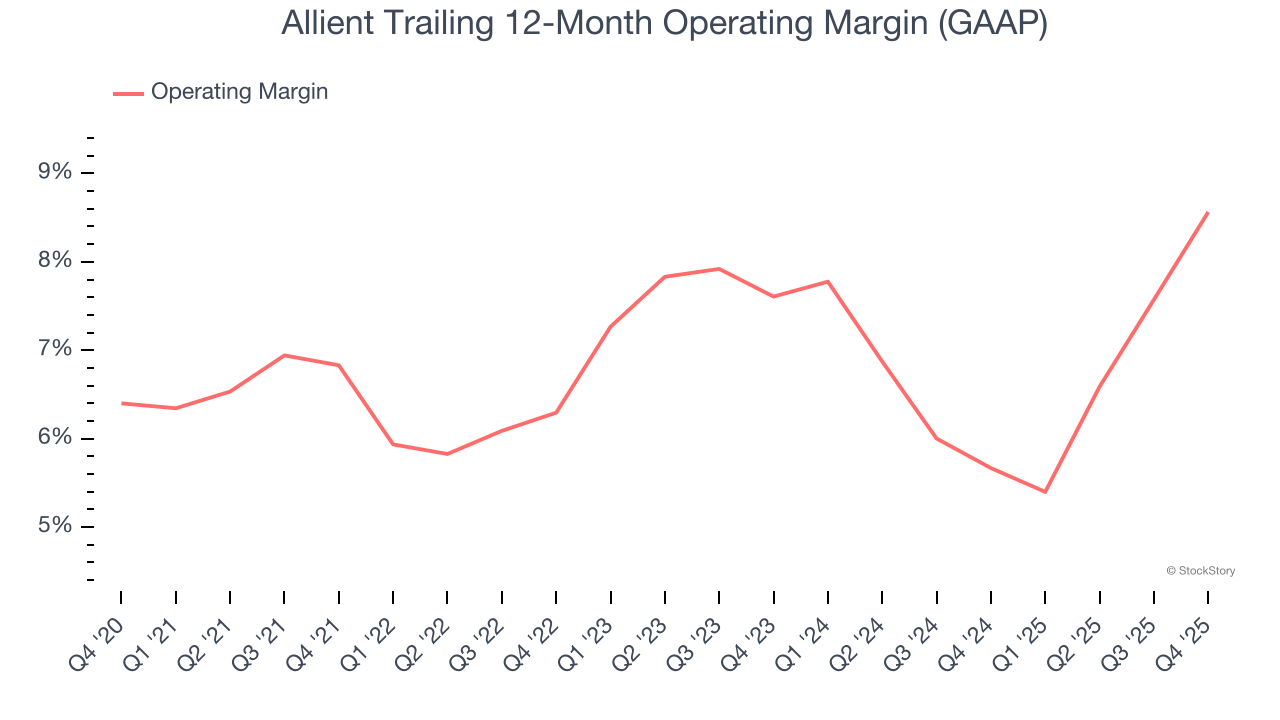
In Q4, Allient generated an operating margin profit margin of 7.9%, up 4.4 percentage points year on year. The increase was encouraging, and because its operating margin rose more than its gross margin, we can infer it was more efficient with expenses such as marketing, R&D, and administrative overhead.
Earnings Per Share
Revenue trends explain a company’s historical growth, but the long-term change in earnings per share (EPS) points to the profitability of that growth – for example, a company could inflate its sales through excessive spending on advertising and promotions.
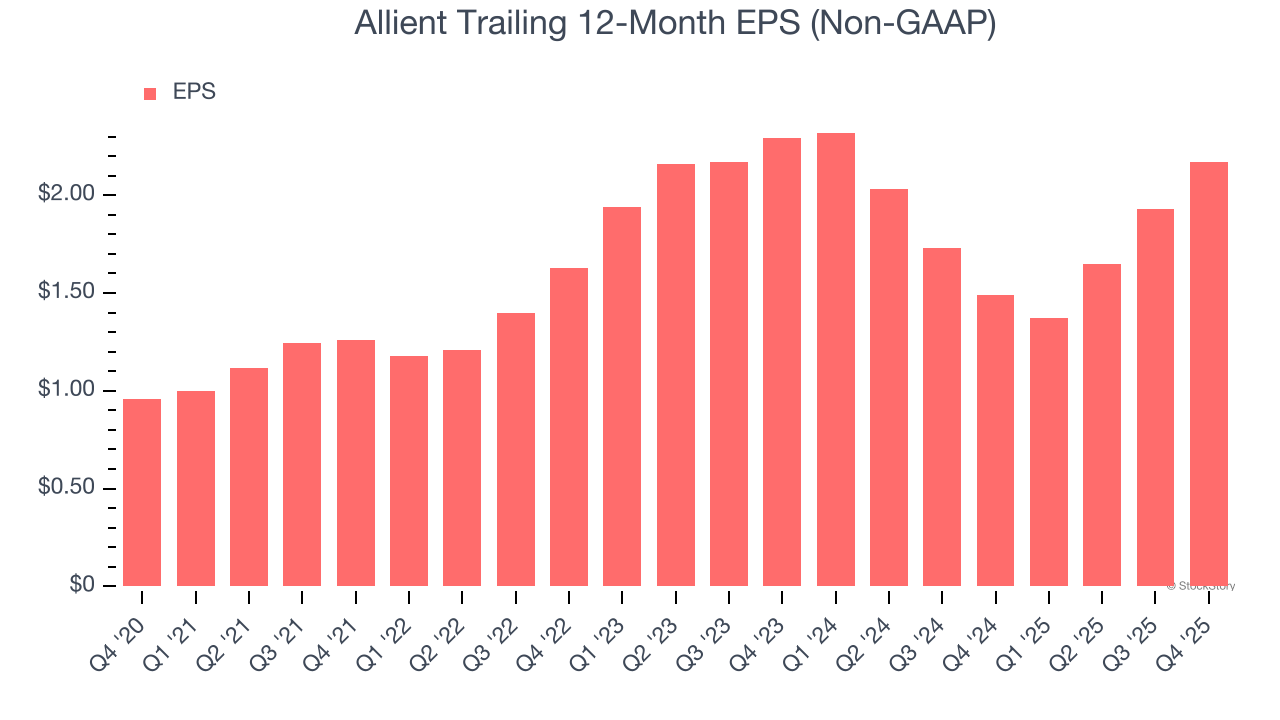
Allient’s EPS grew at 17.7% compounded annual growth rate over the last five years, higher than its 8.6% annualized revenue growth. This tells us the company became more profitable on a per-share basis as it expanded.
Diving into Allient’s quality of earnings can give us a better understanding of its performance. As we mentioned earlier, Allient’s operating margin expanded by 1.7 percentage points over the last five years. This was the most relevant factor (aside from the revenue impact) behind its higher earnings; interest expenses and taxes can also affect EPS but don’t tell us as much about a company’s fundamentals.
Like with revenue, we analyze EPS over a shorter period to see if we are missing a change in the business.
For Allient, its two-year annual EPS declines of 2.7% mark a reversal from its (seemingly) healthy five-year trend. We hope Allient can return to earnings growth in the future.
In Q4, Allient reported adjusted EPS of $0.55, up from $0.31 in the same quarter last year. This print easily cleared analysts’ estimates, and shareholders should be content with the results. Over the next 12 months, Wall Street expects Allient’s full-year EPS of $2.17 to grow 17.1%.
Key Takeaways from Allient’s Q4 Results
We were impressed by how significantly Allient blew past analysts’ EBITDA expectations this quarter. We were also excited its revenue outperformed Wall Street’s estimates by a wide margin. Zooming out, we think this was a solid print. The stock remained flat at $62.19 immediately following the results.
Allient may have had a good quarter, but does that mean you should invest right now? We think that the latest quarter is only one piece of the longer-term business quality puzzle. Quality, when combined with valuation, can help determine if the stock is a buy. We cover that in our actionable full research report which you can read here (it’s free).