Smart home company SmartRent (NYSE: SMRT) met Wall Street’s revenue expectations in Q4 CY2025, with sales up 3.1% year on year to $36.47 million. Its GAAP loss of $0.02 per share was in line with analysts’ consensus estimates.
Is now the time to buy SmartRent? Find out by accessing our full research report, it’s free.
SmartRent (SMRT) Q4 CY2025 Highlights:
- Revenue: $36.47 million vs analyst estimates of $36.3 million (3.1% year-on-year growth, in line)
- EPS (GAAP): -$0.02 vs analyst estimates of -$0.02 (in line)
- Adjusted EBITDA: $214,000 (0.6% margin, 103% year-on-year growth)
- Adjusted EBITDA Margin: 0.6%, up from -20.8% in the same quarter last year
- Free Cash Flow was $5.97 million, up from -$13.26 million in the same quarter last year
- Annual Recurring Revenue: $61.6 million (13.2% year-on-year growth, beat)
- Market Capitalization: $291.4 million
Company Overview
Founded by an employee at a real estate rental company, SmartRent (NYSE: SMRT) provides smart home devices and software for multifamily residential properties, single-family rental homes, and student housing communities.
Revenue Growth
Examining a company’s long-term performance can provide clues about its quality. Any business can put up a good quarter or two, but the best consistently grow over the long haul. Luckily, SmartRent’s sales grew at an incredible 23.7% compounded annual growth rate over the last five years. Its growth beat the average industrials company and shows its offerings resonate with customers, a helpful starting point for our analysis.
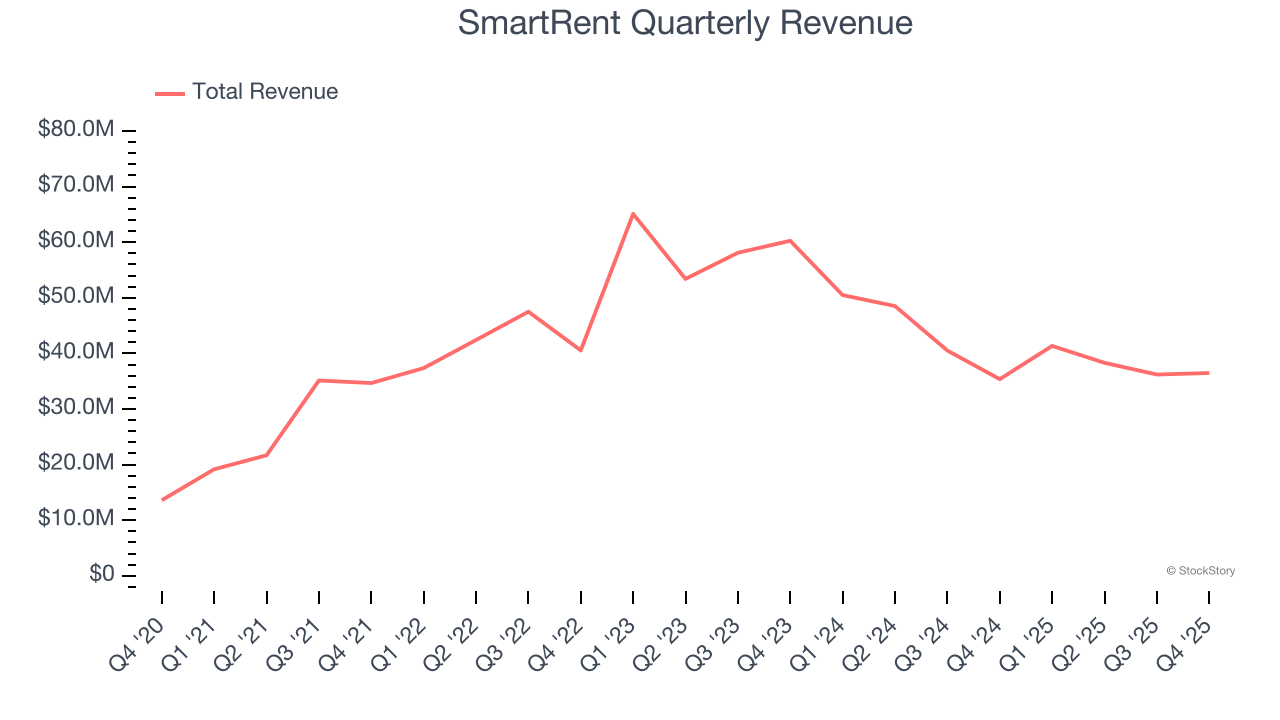
We at StockStory place the most emphasis on long-term growth, but within industrials, a half-decade historical view may miss cycles, industry trends, or a company capitalizing on catalysts such as a new contract win or a successful product line. SmartRent’s recent performance marks a sharp pivot from its five-year trend as its revenue has shown annualized declines of 19.8% over the last two years. 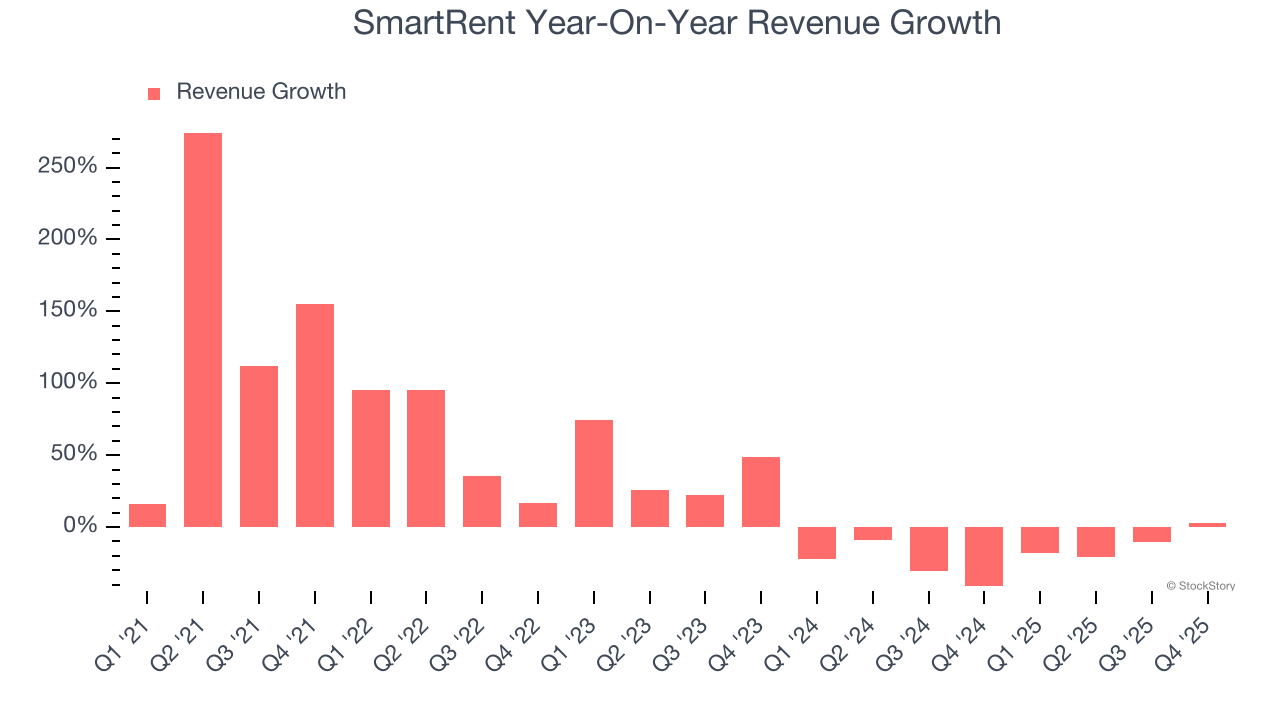
SmartRent also reports its annual recurring revenue (ARR), or the predictable, normalized yearly income from subscriptions and contracts. SmartRent’s ARR reached $61.6 million in the latest quarter and averaged 19.2% year-on-year growth over the last two years. Because this number is better than its normal revenue growth, we can see the company’s proportion of recurring revenue from long-term contracts and subscriptions has increased. This implies more stability in its business model and revenue streams. 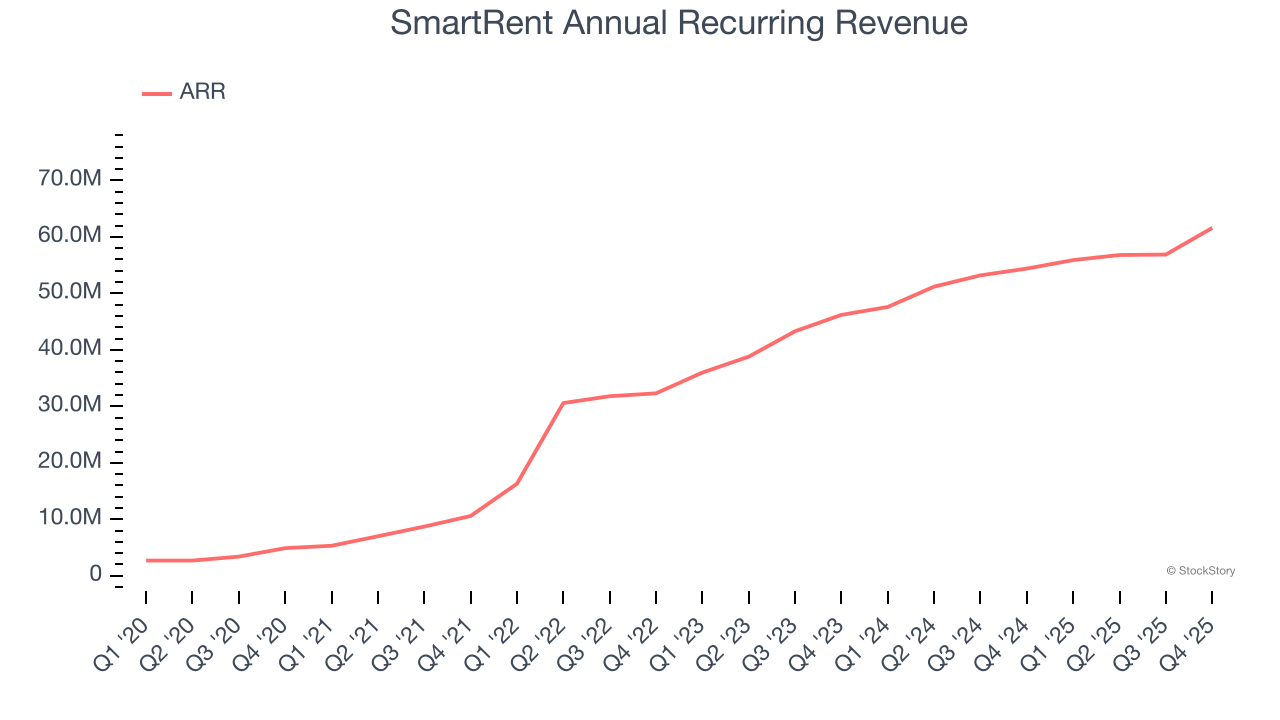
This quarter, SmartRent grew its revenue by 3.1% year on year, and its $36.47 million of revenue was in line with Wall Street’s estimates.
Looking ahead, sell-side analysts expect revenue to grow 4% over the next 12 months. Although this projection implies its newer products and services will fuel better top-line performance, it is still below average for the sector. At least the company is tracking well in other measures of financial health.
ALSO WORTH WATCHING: Nvidia’s Quiet Partner. Nvidia’s chips cost a hundred grand. The connectors that make them work cost even more. One company makes them all.
Every AI server needs specialized infrastructure the chip companies don’t make. High-speed cables. Power connectors. Thermal sensors. This 90-year-old company built a monopoly on it. The AI boom just started. This stock is still flying under the radar. Claim The Stock Ticker Here for FREE.
Operating Margin
SmartRent’s high expenses have contributed to an average operating margin of negative 38.6% over the last five years. Unprofitable industrials companies require extra attention because they could get caught swimming naked when the tide goes out.
On the plus side, SmartRent’s operating margin rose by 22.8 percentage points over the last five years, as its sales growth gave it operating leverage. Still, it will take much more for the company to reach long-term profitability.
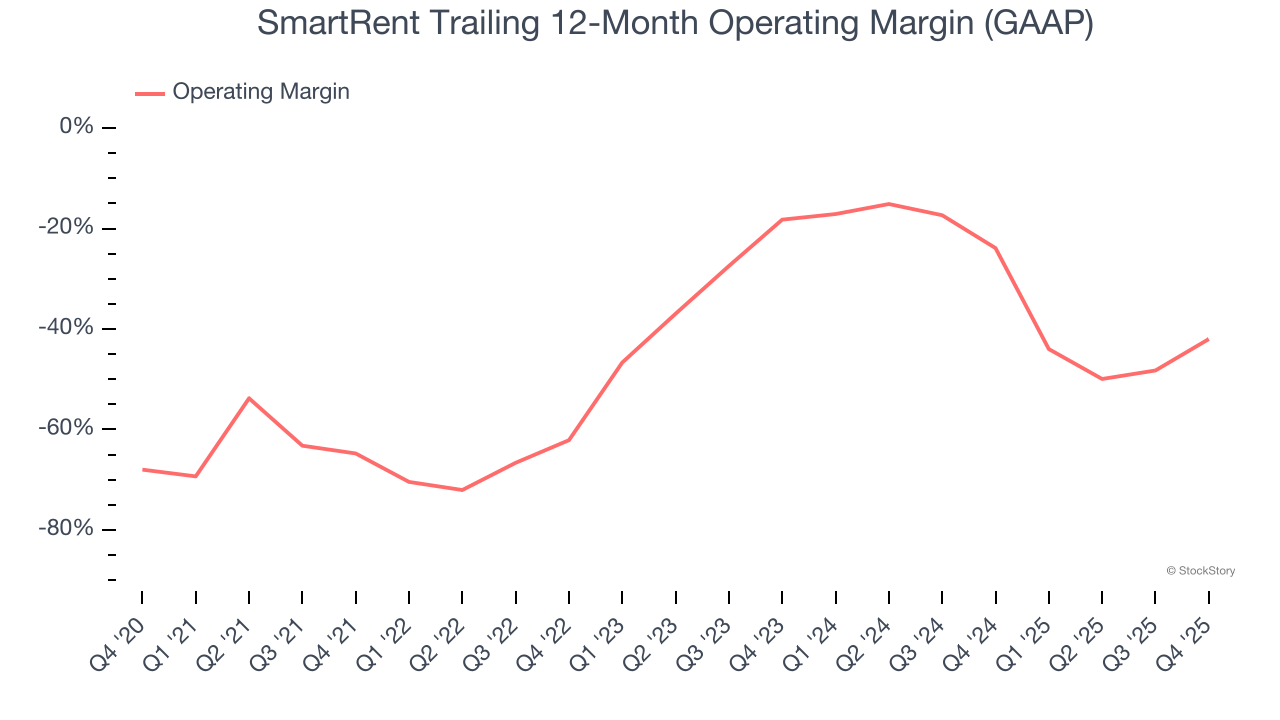
In Q4, SmartRent generated a negative 10.9% operating margin.
Earnings Per Share
We track the long-term change in earnings per share (EPS) for the same reason as long-term revenue growth. Compared to revenue, however, EPS highlights whether a company’s growth is profitable.
Although SmartRent’s full-year earnings are still negative, it reduced its losses and improved its EPS by 53.6% annually over the last five years. The next few quarters will be critical for assessing its long-term profitability.
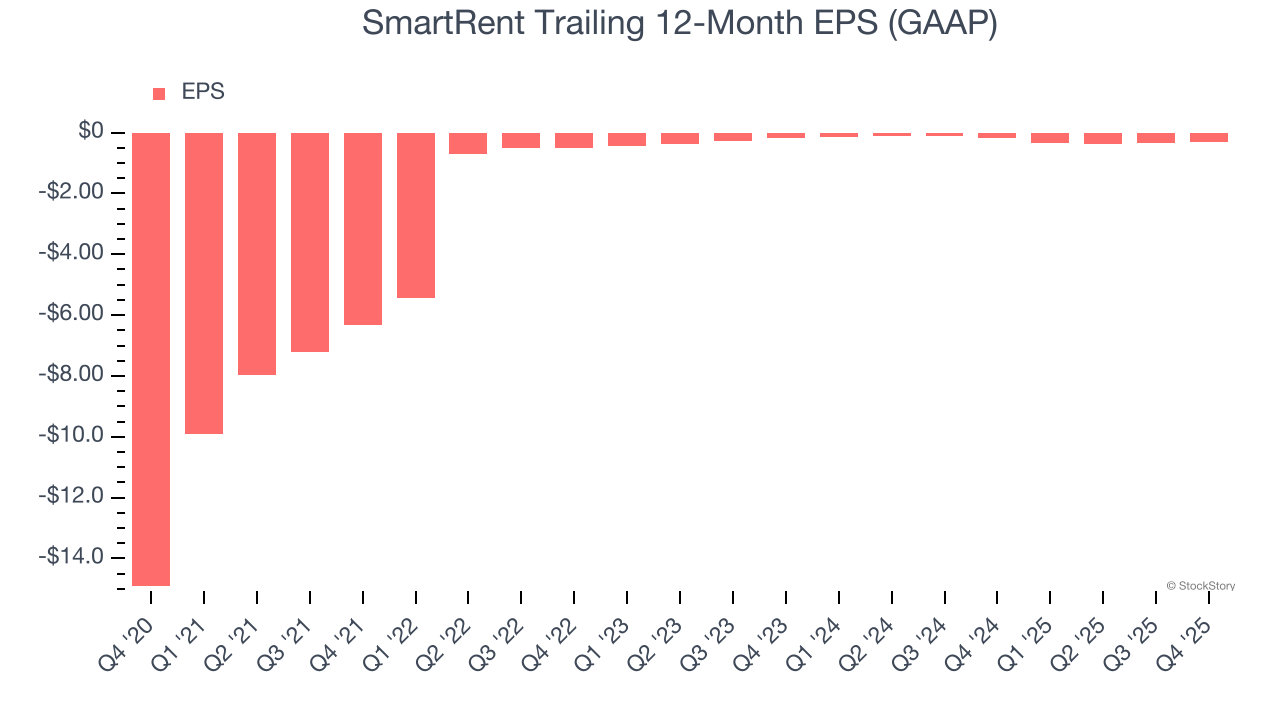
Like with revenue, we analyze EPS over a shorter period to see if we are missing a change in the business.
For SmartRent, its two-year annual EPS declines of 35.9% mark a reversal from its (seemingly) healthy five-year trend. We hope SmartRent can return to earnings growth in the future.
In Q4, SmartRent reported EPS of negative $0.02, up from negative $0.06 in the same quarter last year. This print was close to analysts’ estimates. Over the next 12 months, Wall Street expects SmartRent to improve its earnings losses. Analysts forecast its full-year EPS of negative $0.32 will advance to negative $0.06.
Key Takeaways from SmartRent’s Q4 Results
We were impressed by how significantly SmartRent blew past analysts’ EBITDA expectations this quarter. We were also glad its ARR outperformed Wall Street’s estimates. Zooming out, we think this quarter featured some important positives. The stock traded up 4.6% to $1.60 immediately after reporting.
Indeed, SmartRent had a rock-solid quarterly earnings result, but is this stock a good investment here? What happened in the latest quarter matters, but not as much as longer-term business quality and valuation, when deciding whether to invest in this stock. We cover that in our actionable full research report which you can read here (it’s free).