
Diversified manufacturing and supply chain services provider Park-Ohio (NASDAQ: PKOH) fell short of the market’s revenue expectations in Q4 CY2025 as sales only rose 1.7% year on year to $395 million. On the other hand, the company’s full-year revenue guidance of $1.69 billion at the midpoint came in 1.6% above analysts’ estimates. Its non-GAAP profit of $0.65 per share was 11.6% below analysts’ consensus estimates.
Is now the time to buy Park-Ohio? Find out by accessing our full research report, it’s free.
Park-Ohio (PKOH) Q4 CY2025 Highlights:
- Revenue: $395 million vs analyst estimates of $402.9 million (1.7% year-on-year growth, 2% miss)
- Adjusted EPS: $0.65 vs analyst expectations of $0.74 (11.6% miss)
- Adjusted EBITDA: $35.3 million vs analyst estimates of $34.45 million (8.9% margin, 2.5% beat)
- Adjusted EPS guidance for the upcoming financial year 2026 is $3.05 at the midpoint, missing analyst estimates by 3.2%
- Operating Margin: 2.5%, down from 4.1% in the same quarter last year
- Free Cash Flow Margin: 9.1%, up from 4.2% in the same quarter last year
- Market Capitalization: $361.3 million
Company Overview
Based in Cleveland, Park-Ohio (NASDAQ: PKOH) provides supply chain management services, capital equipment, and manufactured components.
Revenue Growth
A company’s long-term sales performance is one signal of its overall quality. Any business can put up a good quarter or two, but the best consistently grow over the long haul. Unfortunately, Park-Ohio’s 4.3% annualized revenue growth over the last five years was sluggish. This was below our standard for the industrials sector and is a poor baseline for our analysis.
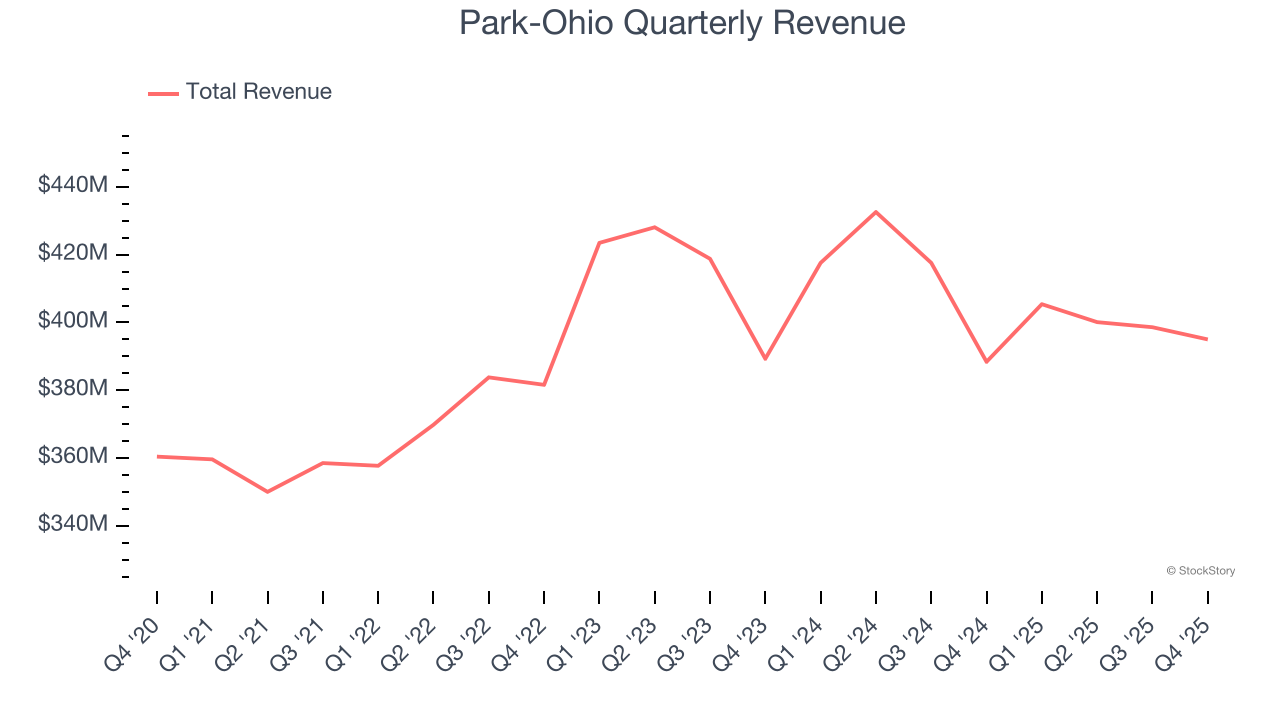
We at StockStory place the most emphasis on long-term growth, but within industrials, a half-decade historical view may miss cycles, industry trends, or a company capitalizing on catalysts such as a new contract win or a successful product line. Park-Ohio’s performance shows it grew in the past but relinquished its gains over the last two years, as its revenue fell by 1.8% annually. 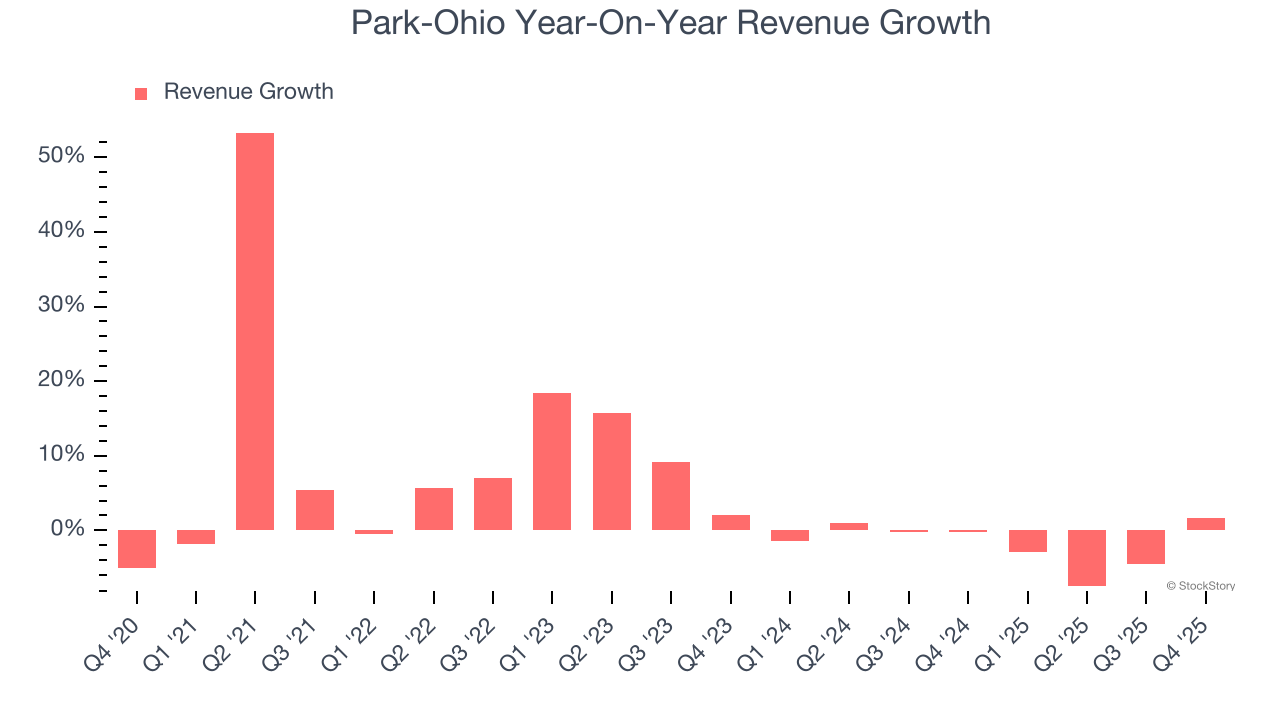
This quarter, Park-Ohio’s revenue grew by 1.7% year on year to $395 million, falling short of Wall Street’s estimates.
Looking ahead, sell-side analysts expect revenue to grow 4.2% over the next 12 months. Although this projection suggests its newer products and services will spur better top-line performance, it is still below average for the sector.
ONE MORE THING: 3 Hidden Platforms Growing 3X Faster than Amazon, Google, and PayPal. Amazon, Google, and Meta all followed the same playbook: Dominate an ignored market. Build an unbeatable moat. Scale until you’re unstoppable.
These three platforms are running that exact playbook right now. The early investors in Amazon made fortunes. The early investors in these could do the same. Get All 3 Stocks Here for FREE.
Operating Margin
Park-Ohio was profitable over the last five years but held back by its large cost base. Its average operating margin of 4.6% was weak for an industrials business. This result isn’t too surprising given its low gross margin as a starting point.
On the plus side, Park-Ohio’s operating margin rose by 3.8 percentage points over the last five years, as its sales growth gave it operating leverage.
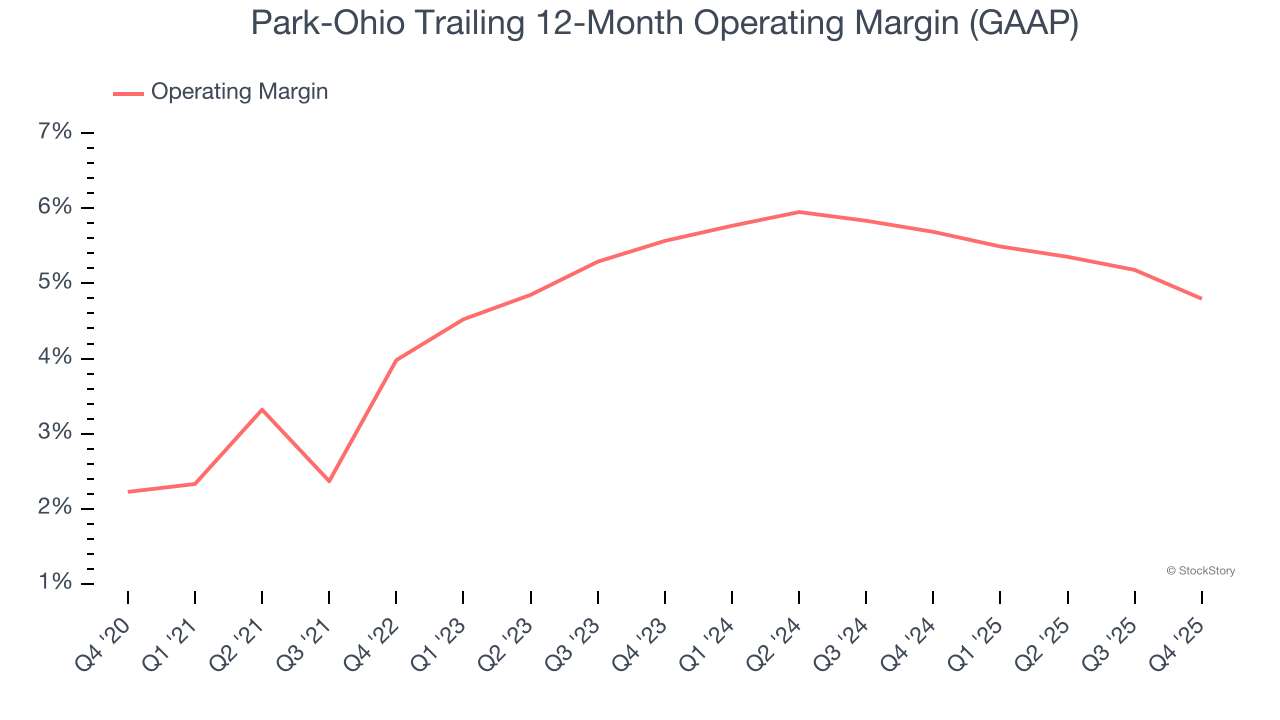
In Q4, Park-Ohio generated an operating margin profit margin of 2.5%, down 1.5 percentage points year on year. Since Park-Ohio’s operating margin decreased more than its gross margin, we can assume it was less efficient because expenses such as marketing, R&D, and administrative overhead increased.
Earnings Per Share
Revenue trends explain a company’s historical growth, but the long-term change in earnings per share (EPS) points to the profitability of that growth – for example, a company could inflate its sales through excessive spending on advertising and promotions.
Park-Ohio’s EPS grew at 207% compounded annual growth rate over the last five years, higher than its 4.3% annualized revenue growth. This tells us the company became more profitable on a per-share basis as it expanded.
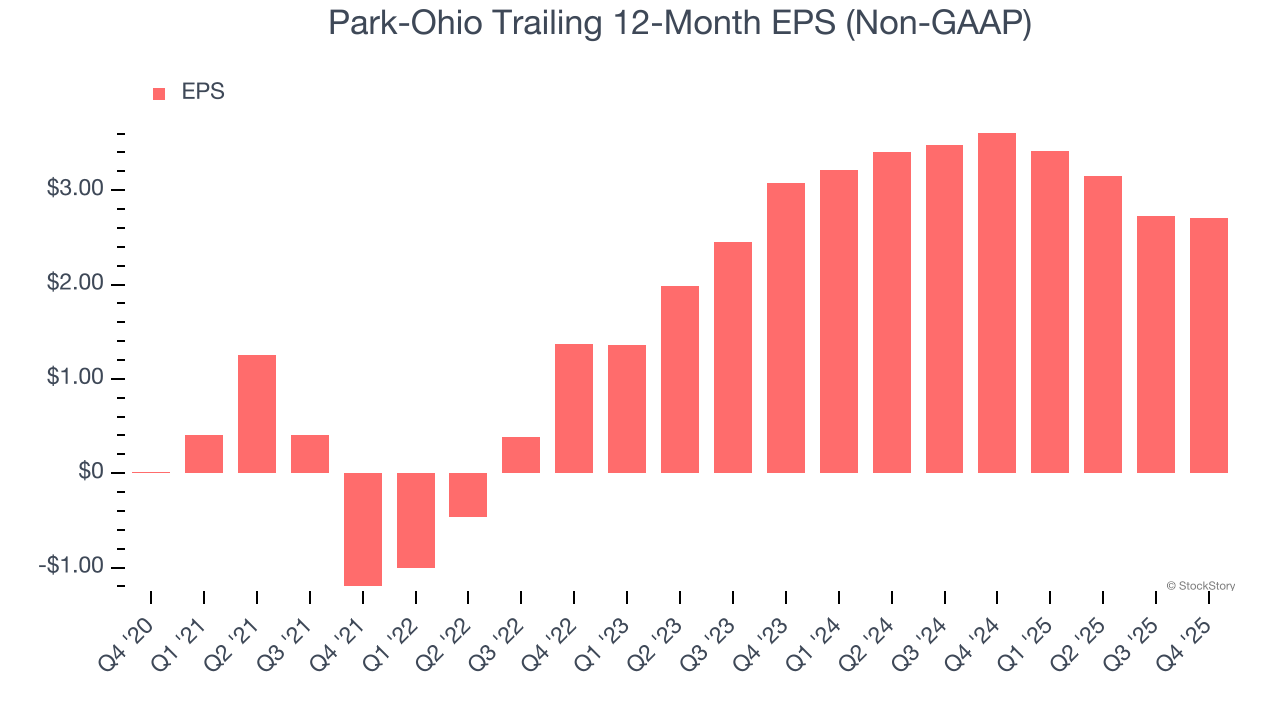
We can take a deeper look into Park-Ohio’s earnings to better understand the drivers of its performance. As we mentioned earlier, Park-Ohio’s operating margin declined this quarter but expanded by 3.8 percentage points over the last five years. This was the most relevant factor (aside from the revenue impact) behind its higher earnings; interest expenses and taxes can also affect EPS but don’t tell us as much about a company’s fundamentals.
Like with revenue, we analyze EPS over a more recent period because it can provide insight into an emerging theme or development for the business.
For Park-Ohio, its two-year annual EPS declines of 6.2% mark a reversal from its (seemingly) healthy five-year trend. We hope Park-Ohio can return to earnings growth in the future.
In Q4, Park-Ohio reported adjusted EPS of $0.65, down from $0.67 in the same quarter last year. This print missed analysts’ estimates, but we care more about long-term adjusted EPS growth than short-term movements. Over the next 12 months, Wall Street expects Park-Ohio’s full-year EPS of $2.71 to grow 16.2%.
Key Takeaways from Park-Ohio’s Q4 Results
It was great to see Park-Ohio’s full-year revenue guidance top analysts’ expectations. We were also happy its EBITDA outperformed Wall Street’s estimates. On the other hand, its full-year EPS guidance missed and its EPS fell short of Wall Street’s estimates. Overall, this quarter could have been better. The stock remained flat at $26.50 immediately following the results.
The latest quarter from Park-Ohio’s wasn’t that good. One earnings report doesn’t define a company’s quality, though, so let’s explore whether the stock is a buy at the current price. We think that the latest quarter is only one piece of the longer-term business quality puzzle. Quality, when combined with valuation, can help determine if the stock is a buy. We cover that in our actionable full research report which you can read here (it’s free).