

Insurance and technology company HCI Group (NYSE: HCI) missed Wall Street’s revenue expectations in Q3 CY2025, but sales rose 23.4% year on year to $216.4 million. Its GAAP profit of $4.90 per share was significantly above analysts’ consensus estimates.
Is now the time to buy HCI Group? Find out by accessing our full research report, it’s free for active Edge members.
HCI Group (HCI) Q3 CY2025 Highlights:
Management Commentary“This was another strong quarter, marked by solid profitability, industry-leading net combined ratios, and meaningful growth in book value per share,” said HCI Group Chairman and Chief Executive Officer Paresh Patel.
Company Overview
Starting as a Florida "take-out" insurer that assumed policies from the state-backed Citizens Property Insurance Corporation, HCI Group (NYSE: HCI) provides property and casualty insurance, primarily homeowners coverage, while leveraging proprietary technology to improve underwriting and claims processing.
Revenue Growth
Big picture, insurers generate revenue from three key sources. The first is the core business of underwriting policies. The second source is income from investing the “float” (premiums collected upfront not yet paid out as claims) in assets such as fixed-income assets and equities. The third is fees from various sources such as policy administration, annuities, or other value-added services. Thankfully, HCI Group’s 21.9% annualized revenue growth over the last five years was incredible. Its growth surpassed the average insurance company and shows its offerings resonate with customers, a great starting point for our analysis.
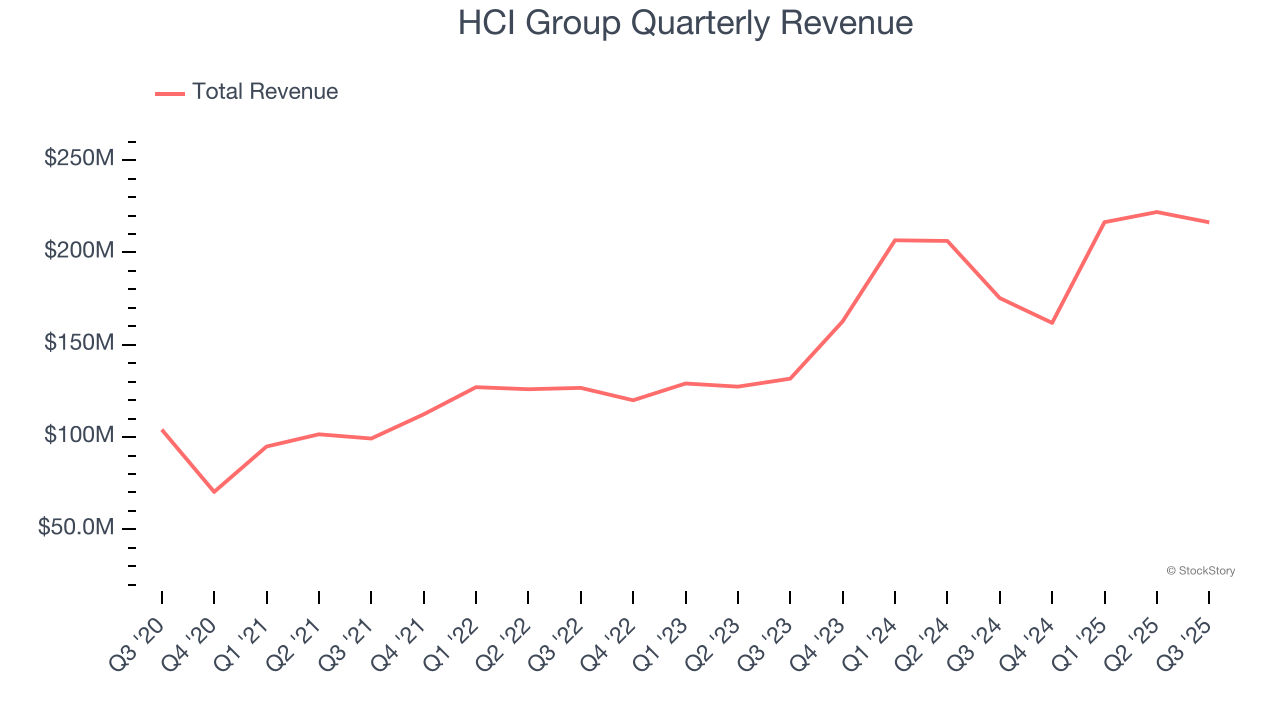
We at StockStory place the most emphasis on long-term growth, but within financials, a half-decade historical view may miss recent interest rate changes, market returns, and industry trends. HCI Group’s annualized revenue growth of 26.8% over the last two years is above its five-year trend, suggesting its demand was strong and recently accelerated.  Note: Quarters not shown were determined to be outliers, impacted by outsized investment gains/losses that are not indicative of the recurring fundamentals of the business.
This quarter, HCI Group generated an excellent 23.4% year-on-year revenue growth rate, but its $216.4 million of revenue fell short of Wall Street’s high expectations.
Net premiums earned made up 91.2% of the company’s total revenue during the last five years, meaning HCI Group lives and dies by its underwriting activities because non-insurance operations barely move the needle.
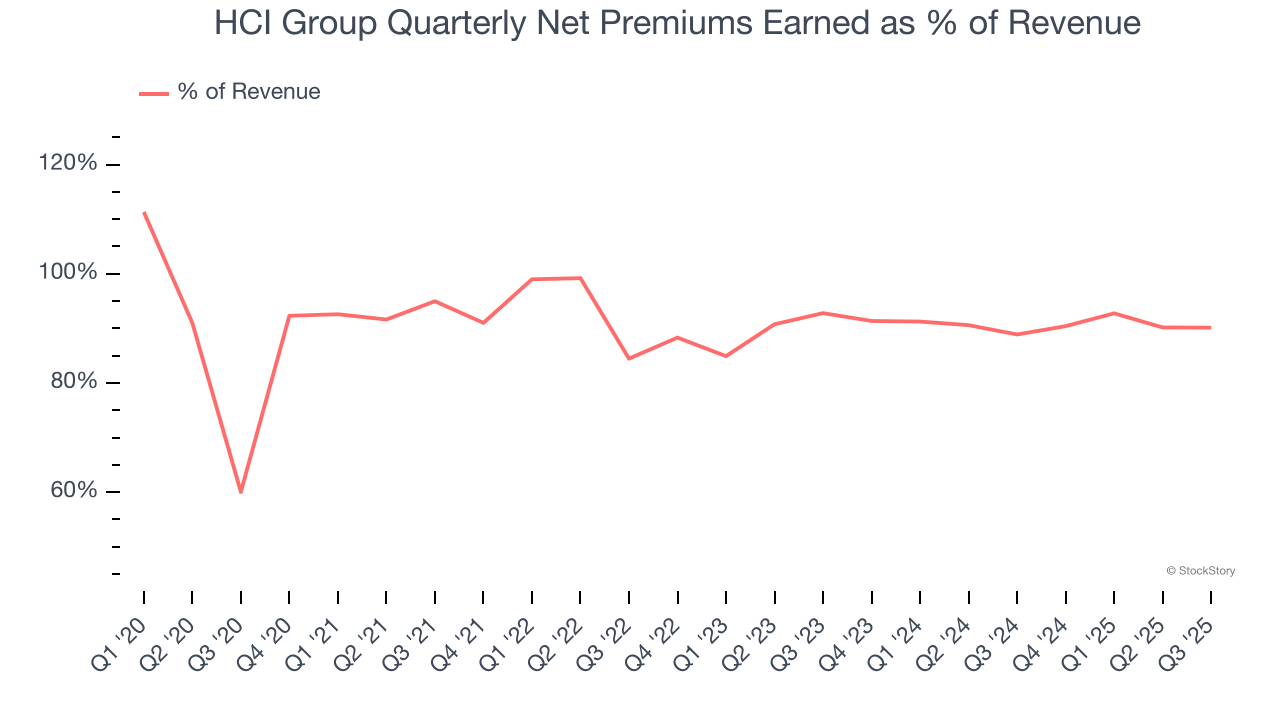
Our experience and research show the market cares primarily about an insurer’s net premiums earned growth as investment and fee income are considered more susceptible to market volatility and economic cycles.
Software is eating the world and there is virtually no industry left that has been untouched by it. That drives increasing demand for tools helping software developers do their jobs, whether it be monitoring critical cloud infrastructure, integrating audio and video functionality, or ensuring smooth content streaming. Click here to access a free report on our 3 favorite stocks to play this generational megatrend.
Book Value Per Share (BVPS)
Insurers are balance sheet businesses, collecting premiums upfront and paying out claims over time. Premiums collected but not yet paid out, often referred to as the float, are invested and create an asset base supported by a liability structure. Book value per share (BVPS) captures this dynamic by measuring these assets (investment portfolio, cash, reinsurance recoverables) less liabilities (claim reserves, debt, future policy benefits). BVPS is essentially the residual value for shareholders.
We therefore consider BVPS very important to track for insurers and a metric that sheds light on business quality because it reflects long-term capital growth and is harder to manipulate than more commonly-used metrics like EPS.
HCI Group’s BVPS grew at an incredible 19.9% annual clip over the last five years. BVPS growth has also accelerated recently, growing by 65.1% annually over the last two years from $23.27 to $63.41 per share.
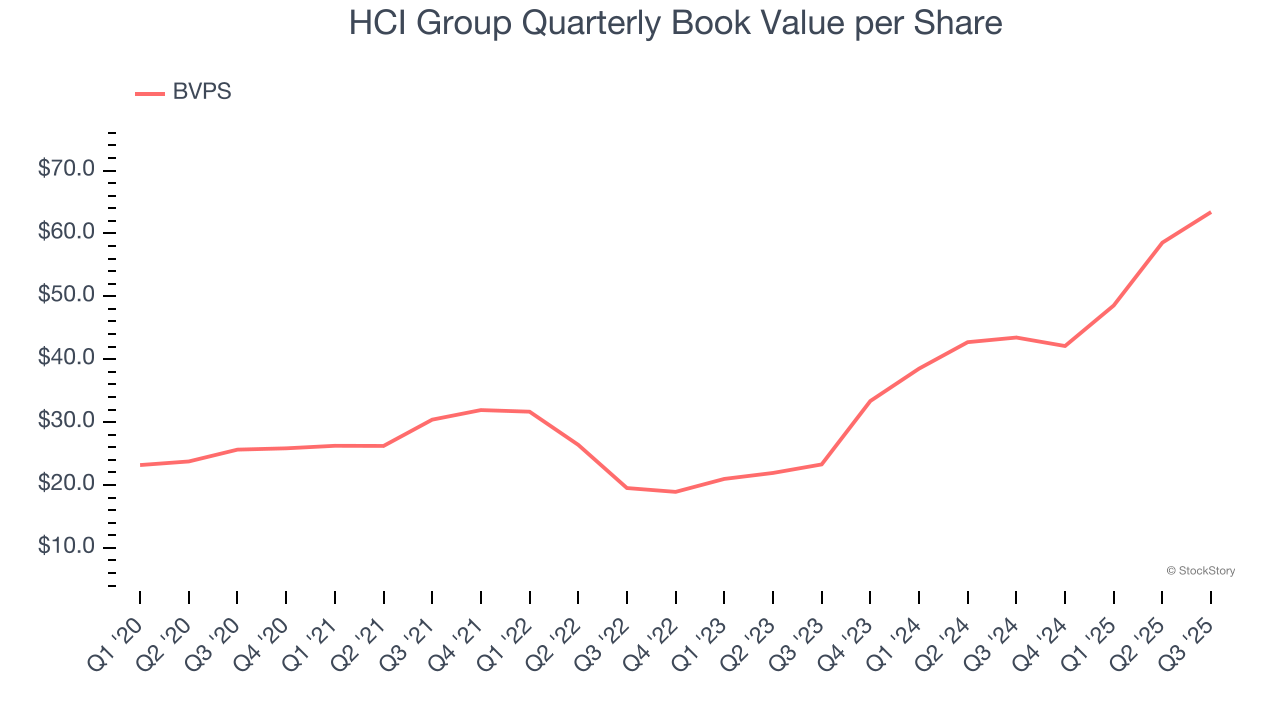
Over the next 12 months, Consensus estimates call for HCI Group’s BVPS to grow by 15.7% to $59.43, top-notch growth rate.
Key Takeaways from HCI Group’s Q3 Results
We were impressed by how significantly HCI Group blew past analysts’ book value per share expectations this quarter. We were also glad its EPS outperformed Wall Street’s estimates. On the other hand, its revenue missed and its net premiums earned fell short of Wall Street’s estimates. Overall, we think this was still a solid quarter with some key areas of upside. The stock traded up 1.8% to $198.75 immediately after reporting.
HCI Group may have had a good quarter, but does that mean you should invest right now? We think that the latest quarter is only one piece of the longer-term business quality puzzle. Quality, when combined with valuation, can help determine if the stock is a buy. We cover that in our actionable full research report which you can read here, it’s free for active Edge members.


