SSR Mining Inc. (Nasdaq/TSX: SSRM) (“SSR Mining” or the “Company”) announces the results of a Technical Report Summary (“TRS”) for the Cripple Creek & Victor Gold Mine (“CC&V”) in Colorado, USA (the “2025 CC&V TRS”).
This press release features multimedia. View the full release here: https://www.businesswire.com/news/home/20251109711532/en/
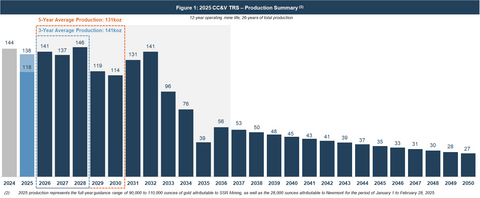
Figure 1: 2025 CC&V TRS – Production Summary (2): 2025 production represents the full-year guidance range of 90,000 to 110,000 ounces of gold attributable to SSR Mining, as well as the 28,000 ounces attributable to Newmont for the period of January 1 to February 28, 2025.
Highlights of the 2025 CC&V TRS:
-
After-tax NPV5% of $824 million at consensus gold prices averaging $3,240 per ounce over the life of mine
- After-tax NPV5% increases to approximately $1.5 billion at a gold price of $4,000 per ounce
- 12-year mine life, 26 years of total production based on 2.8 million ounces of gold Mineral Reserves
-
Average annual production of 141,000 ounces of gold over the three-year period from 2026 to 2028
-
Over the same three-year period, annual after-tax operating cash flow and free cash flow averages $196 million, and $128 million, respectively, based on consensus gold prices(1)
- At a gold price of $4,000 per ounce, annual after-tax operating cash flow and free cash flow from 2026 to 2028 averages $235 million and $168 million, respectively
-
Over the same three-year period, annual after-tax operating cash flow and free cash flow averages $196 million, and $128 million, respectively, based on consensus gold prices(1)
-
Measured & Indicated Mineral Resources, exclusive of Mineral Reserves, total 4.8 million ounces of gold with an additional 2.0 million ounces of Inferred Mineral Resources, highlighting potential for future growth
- The gold prices used in the calculation of CC&V Mineral Reserves and Mineral Resources are $1,700/oz and $2,000/oz, respectively. These gold price assumptions are unchanged from CC&V’s prior Mineral Reserve and Mineral Resource statement as of December 31, 2024
- Based on the upfront $100 million cash payment in February 2025, upcoming contingent payments, realized mine site after-tax free cash flow and the TRS free cash flow projections, the acquisition of CC&V has an implied after-tax transaction IRR in excess of 100%
| ______________________ |
(1) Company reports non-GAAP financial measures including after-tax free cash flow to manage and evaluate its operating performance at its mines. See "Cautionary Note Regarding Non-GAAP Financial Measures" for an explanation of this financial measure to the most comparable GAAP financial measures. |
Rod Antal, Executive Chairman of SSR Mining, said, “The transformational acquisition of CC&V established SSR Mining as the third largest gold producer in the United States, with two core operations each with mine lives in excess of 10 years. Following a very successful integration process, CC&V has already paid back the initial $100 million upfront acquisition price in mine-site after-tax free cash flow. Including the total potential transaction outlay of $275 million, the results from this initial Technical Report Summary demonstrate a transaction IRR in excess of 100%, a truly exceptional outcome with meaningful growth potential for the operation still ahead.
Today’s initial life of mine plan already demonstrates a long-lived operation and with nearly five million ounces of Measured & Indicated Mineral Resources and two million ounces of Inferred Mineral Resources, there is a clear opportunity for future growth.”
The TRS, with an effective date of July 1, 2025, has been prepared in accordance with S-K 1300 and will be available by November 14, 2025 on the Company’s website and on a Current Report on Form 8-K to be filed with the U.S. Securities and Exchange Commission (“SEC”).
Table 1: CC&V TRS Highlights at Consensus Gold Prices |
|||
|
|
Three-Year Profile |
Five-Year Profile |
|
Unit |
2026 – 2028 |
2026 – 2030 |
Total Gold Production |
Au koz |
424 |
657 |
Average Annual Gold Production |
Au koz |
141 |
131 |
|
|
|
|
Total Operating Cash Flow (GAAP) |
$M |
$587 |
$761 |
Total Capital Costs (GAAP) (3) |
$M |
$203 |
$283 |
Total Free Cash Flow (non-GAAP) (4) |
$M |
$384 |
$478 |
Average Annual Free Cash Flow |
$M |
$128 |
$96 |
|
|
|
|
Cost of Sales (GAAP) |
$/oz sold |
$1,799 |
$1,901 |
Cash Costs (non-GAAP) (4) |
$/oz sold |
$1,800 |
$1,902 |
All-In Sustaining Costs (non-GAAP) (4) |
$/oz sold |
$2,051 |
$2,135 |
(3) Total capital costs include sustaining capital, development capital, and reclamation. |
|||
(4) The Company reports non-GAAP financial measures including after-tax free cash flow and All-In Sustaining Cost (“AISC”) per ounce sold (a common measure in the mining industry), to manage and evaluate its operating performance at its mines. All cash flow figures are presented after tax. Free cash flow is calculated as operating cash flow less capital costs. AISC include costs associated with non-cash inventory movements. See "Cautionary Note Regarding Non-GAAP Financial Measures" for an explanation of Cash Costs and AISC and a reconciliation of these financial measures to the most comparable GAAP financial measures. |
|||
Table 2: 2025 CC&V TRS – After-Tax NPV Sensitivity |
|||||
LOM Gold Prices |
$/oz |
$2,754 |
Base Case (5) |
$3,726 |
$4,212 |
Sensitivity |
% |
-15% |
— |
+15% |
+30% |
NPV5% |
$M |
$340 |
$824 |
$1,299 |
$1,767 |
(5) Base Case gold price assumption averages $3,433/oz from 2025 to 2030 and $3,094/oz for the remainder of the mine life. |
|||||
Since closing of the CC&V acquisition during the first quarter of 2025, the mine has produced 85,165 ounces of gold from February 28, 2025 to September 30, 2025, and continues to track to the top-end of its attributable 2025 production guidance of 90,000 to 110,000 ounces. Over this same time period, CC&V has generated approximately $115 million in mine site after-tax free cash flow to SSR Mining. Inclusive of the $100 million upfront cash payment and $175 million in future contingent payments, realized free cash flow and the life of mine projections outlined in the 2025 CC&V TRS, the acquisition is expected to provide SSR Mining with an IRR in excess of 100%.
CC&V Mineral Reserves and Mineral Resources (“MRMR”) (7)
| (7) Please see “Supplemental Mineral Reserve and Mineral Resource Information” at the end of this press release for additional details. Mineral Resources are exclusive of Mineral Reserves. Numbers may not add due to rounding. | |||
Table 3: SSR Mining CC&V MRMR as of July 1, 2025 |
|||
(100% attributable) |
Tonnes (kt) |
Grade (g/t) |
Gold (koz) |
Total P+P Reserves |
235,134 |
0.37 |
2,814 |
M&I Mineral Resources |
344,844 |
0.44 |
4,845 |
Inferred Mineral Resources |
149,603 |
0.41 |
1,966 |
The majority of ore mined in the 2025 CC&V TRS is expected to be sourced from the currently active Globe Hill, Schist Island and South Cresson pits. On average, the operating period from 2026 to 2036 includes average stacking rates of 52,000 tonnes per day, and total material movement rates of 85,000 tonnes per day for a life of mine strip ratio of 0.65:1. The average life of mine gold recovery is 51.6%, with an average stacked grade of 0.39 grams per tonne. Approximately 5% of all ore stacked over the life of mine is currently planned to be crushed, with the remainder placed as Run of Mine ("ROM") ore. Placement rates and crushed versus ROM considerations reflect thorough technical analysis and ensure a minimum sufficient leach cycle time of 120 days. The TRS production plan also includes approximately 334,000 ounces of recoverable gold currently in process inventory.
The CC&V mine is grid connected, with emergency power available via backup diesel generators for critical systems. The current CC&V heavy equipment fleet includes 17 haul trucks, two front-end loaders and two hydraulic shovels. NSR royalties across the CC&V property range from 0.5% to 10.0%, with an effective life of mine average royalty rate of 5%.
Table 4: 2025 CC&V TRS – Operating Metrics Summary |
||
|
Unit |
Life of Mine |
Total Material Mined |
Mt |
373 |
Average Daily Mining Rate |
ktpd |
85 |
|
|
|
Total Ore Mined |
Mt |
226 |
Total Waste Mined |
Mt |
146 |
Strip Ratio |
W:O |
0.65 |
|
|
|
Total Ore Stacked |
Mt |
226 |
Average Daily Stacking Rate |
ktpd |
52 |
Ore Grade Stacked |
g/t Au |
0.39 |
Contained Gold Stacked |
koz |
2,832 |
Gold Recovery |
% |
51.6 |
Additional potential for upside at CC&V
The CC&V property covers over 15,000 acres within one of the most prolific gold mining districts in US history. More than 2.8 million meters of drilling have been completed across more than 17,000 drill holes on the CC&V property. While not all of this historical drilling has been factored into current Mineral Reserve and Mineral Resource compilations, as of July 1, 2025, CC&V hosted more than 4.8 million ounces of Measured and Indicated Mineral Resources and an additional 2.0 million ounces of Inferred Mineral Resources, both exclusive of Mineral Reserves.
These significant Mineral Resources present considerable potential for growth in the future. A constraint in the definition of Mineral Reserves as compared to Mineral Resources is the available Valley Leach Facility (“VLF”) capacity for the placement of additional ore tonnes. The Mineral Reserves included in the 2025 CC&V TRS are therefore constrained by the VLF capacity provided by the currently in-process Amendment 14 permit with the Colorado Division of Reclamation, Mining, and Safety (“DRMS”) and Teller County. Amendment 14, once approved, will provide incremental heap leach pad capacity to process 171 million tonnes (189 million short tons) and support the CC&V Mineral Reserve life as outlined in the 2025 TRS.
SSR Mining is continuing to evaluate other opportunities for future growth at CC&V, including additional resource development and exploration drilling across the property, as well as opportunities for fleet optimization and other potential operating improvements.
2025 CC&V Transaction Overview (8)
As announced in December 2024, consideration for the acquisition of CC&V was comprised of a $100 million upfront cash payment made on closing of the transaction on February 28, 2025, as well as up to $175 million in cash milestone-based payments. These milestone payments were separated into two tranches:
- $87.5 million will be payable upon final approval of the application to amend the CC&V Cresson Permit (“Amendment 14”). This permit amendment was filed by Newmont on April 25, 2024, with the scope to extend the life of mine by adding 189 million short tons (171 million metric tonnes) of leach pad capacity through construction of Phase 4 of the Valley Leach Facility 2 (“VLF2”) and Phase 6 of Valley Leach Facility 1 (“VLF1”), amongst other operational considerations including pit laybacks and road adjustments; and
- Up to $87.5 million will be payable upon obtaining regulatory relief relating to flow-related permitting requirements for the Carlton Tunnel, including steps taken to achieve the highest feasible alternative in relation to Carlton Tunnel water flow.
Upon completion of an updated regulator-approved closure plan and in the event aggregate closure costs at CC&V exceed $500 million, SSR Mining will be responsible for funding 10% of the incremental closure costs while Newmont will be responsible for funding 90% of the incremental closure costs, either on an as-incurred basis or pursuant to a lump sum payment option. Reclamation and closure costs in the 2025 CC&V TRS total $517 million.
| __________________________ |
(8) For additional information regarding the CC&V Transaction, please see our press release titled “SSR Mining Announces the Acquisition of Cripple Creek & Victor Gold Mine From Newmont” dated December 6, 2024 |
Assumptions
All figures are in U.S. dollars, unless otherwise noted. The gold price used in the calculation of Mineral Reserves was $1,700 per ounce and the gold price used in the calculation of Mineral Resource was $2,000 per ounce. The TRS is based on gold prices of: 2025 - $3,322/oz; 2026 - $3,793/oz; 2027 - $3,704/oz; 2028 - $3,396/oz; 2029 - $3,252/oz; 2030 - $3,130/oz; and long-term - $3,094/oz. All references to tonnage in this press release are in metric tonnes unless otherwise noted. Key assumptions used in the preparation of the TRS are subject to risks and uncertainties described under “Cautionary Note Regarding Forward-Looking Information and Statements”. All figures are presented on a 100% basis, unless otherwise noted.
CC&V Technical Report Summary
The CC&V TRS is expected to be included as an exhibit to our Current Report on Form 8-K that we file with the SEC by November 14, 2025 and will be available for review on EDGAR at sec.gov at that time. This press release does not purport to be a complete summary of the CC&V TRS and is qualified in its entirety by reference to the CC&V TRS that we will file with the SEC. You should read this press release in conjunction with the CC&V TRS, including the qualifications and limitations described therein, as there may be information in the CC&V TRS that may be important.
About SSR Mining
SSR Mining is listed under the ticker symbol SSRM on the Nasdaq and the TSX.
Cautionary Note Regarding Forward-Looking Information and Statements:
Except for statements of historical fact relating to us, certain statements contained in this news release constitute forward-looking information, future oriented financial information, or financial outlooks (collectively “forward-looking information”) within the meaning of applicable securities laws. Forward-looking information may be contained in this document and our other public filings. Forward-looking information relates to statements concerning our outlook and anticipated events or results and in some cases, can be identified by terminology such as “may”, “will”, “could”, “should”, “expect”, “plan”, “anticipate”, “believe”, “intend”, “estimate”, “projects”, “predict”, “potential”, “continue” or other similar expressions concerning matters that are not historical facts.
Forward-looking information and statements in this news release are based on certain key expectations and assumptions made by us. Although we believe that the expectations and assumptions on which such forward-looking information and statements are based are reasonable, undue reliance should not be placed on the forward-looking information and statements because we can give no assurance that they will prove to be correct. Forward-looking information and statements are subject to various risks and uncertainties which could cause actual results and experience to differ materially from the anticipated results or expectations expressed in this news release. The key risks and uncertainties include, but are not limited to: local and global political and economic conditions; governmental and regulatory requirements and actions by governmental authorities, including changes in government policy, government ownership requirements, changes in environmental, tax and other laws or regulations and the interpretation thereof; developments with respect to global pandemics, including the duration, severity and scope of a pandemic and potential impacts on mining operations; risks and uncertainties resulting from the incident at Çöpler described in our Annual Report on Form 10-K for the year ended December 31, 2024; and other risk factors detailed from time to time in our reports filed with the Securities and Exchange Commission on EDGAR and the Canadian securities regulatory authorities on SEDAR.
Forward-looking information and statements in this news release include any statements concerning, among other things: all information related to the Company’s CC&V operations, including forecasts and outlook; preliminary cost reporting in this document; timing, production, operating, cost, and capital expenditure guidance; our operational and development targets and catalysts and the impact of any suspensions on operations; the results of any gold reconciliations; the ability to discover additional oxide gold ore; the generation of free cash flow and payment of dividends; matters relating to proposed exploration; communications with local stakeholders; maintaining community and government relations; negotiations of joint ventures; negotiation and completion of transactions; commodity prices; Mineral Resources, Mineral Reserves, conversion of Mineral Resources, realization of Mineral Reserves, and the existence or realization of Mineral Resource estimates; the development approach; the timing and amount of future production; the timing of studies, announcements, and analysis; the timing of construction and development of proposed mines and process facilities; capital and operating expenditures; economic conditions; availability of sufficient financing; exploration plans; receipt of regulatory approvals; timing and impact surrounding suspension or interruption of operations as a result of regulatory requirements or actions by governmental authority; and any and all other timing, exploration, development, operational, financial, budgetary, economic, legal, social, environmental, regulatory, and political matters that may influence or be influenced by future events or conditions.
Such forward-looking information and statements are based on a number of material factors and assumptions, including, but not limited in any manner to, those disclosed in any other of our filings on EDGAR and SEDAR, and include: the assumptions made in respect of the Company’s Çöpler operations; the inherent speculative nature of exploration results; the ability to explore; communications with local stakeholders; maintaining community and governmental relations; status of negotiations of joint ventures; weather conditions at our operations; commodity prices; the ultimate determination of and realization of Mineral Reserves; existence or realization of Mineral Resources; the development approach; availability and receipt of required approvals, titles, licenses and permits; sufficient working capital to develop and operate the mines and implement development plans; access to adequate services and supplies; foreign currency exchange rates; interest rates; access to capital markets and associated cost of funds; availability of a qualified work force; ability to negotiate, finalize, and execute relevant agreements; the Company’s ability to efficiently integrate acquired mines and businesses and to manage the costs related to any such integration, or to retain key technical, professional or management personnel; lack of social opposition to our mines or facilities; lack of legal challenges with respect to our properties; the timing and amount of future production; the ability to meet production, cost, and capital expenditure targets; timing and ability to produce studies and analyses; capital and operating expenditures; economic conditions; availability of sufficient financing; the ultimate ability to mine, process, and sell mineral products on economically favorable terms; and any and all other timing, exploration, development, operational, financial, budgetary, economic, legal, social, geopolitical, regulatory and political factors that may influence future events or conditions. While we consider these factors and assumptions to be reasonable based on information currently available to us, they may prove to be incorrect.
The above list is not exhaustive of the factors that may affect any of the Company’s forward-looking information. You should not place undue reliance on forward-looking information and statements. Forward-looking information and statements are only predictions based on our current expectations and our projections about future events. Actual results may vary from such forward-looking information for a variety of reasons including, but not limited to, risks and uncertainties disclosed in our filings on our website at www.ssrmining.com, on SEDAR at www.sedarplus.ca, and on EDGAR at www.sec.gov and other unforeseen events or circumstances. Other than as required by law, we do not intend, and undertake no obligation to update any forward-looking information to reflect, among other things, new information or future events. The information contained on, or that may be accessed through, our website is not incorporated by reference into, and is not a part of, this document.
Qualified Persons
The scientific and technical information concerning our mineral projects in this news release have been reviewed and verified by SLR International Corporation, a “qualified person” under subpart 1 of Regulation S-K 1300 (“S-K 1300”). For a description of the key assumptions, parameters and methods used to estimate mineral reserves and mineral resources included in this news release, as well as data verification procedures and a general discussion of the extent to which the estimates may be affected by any known environmental, permitting, legal, title, taxation, sociopolitical, marketing or other relevant factors, please review the Technical Report Summaries for the properties discussed in this news release, which are available under the Company’s corporate profile on EDGAR at www.sec.gov.
Supplemental Mineral Reserve and Mineral Resource Information
CC&V’s Mineral reserves and Mineral Resources have been classified in accordance with the definitions for Mineral Resources in S-K 1300. Mineral Resources are presented on a project basis and have an effective date of July 1, 2025. Mineral Reserves and Mineral Resources have been reported on a 100% basis as SSR Mining wholly owns the property.
SSRM |
|
Proven |
Probable |
Proven + Probable |
|
Metallurgical |
||||||||||
Gold |
Country |
Share |
|
Tonnage |
Au Grade |
Gold |
Tonnage |
Au Grade |
Gold |
Tonnage |
Au Grade |
Gold |
|
Recovery |
||
(%) |
|
(kt) |
(g/t) |
(koz) |
(kt) |
(g/t) |
(koz) |
(kt) |
(g/t) |
(koz) |
|
(%) |
||||
CC&V (OP) |
United States |
100% |
|
115,160 |
0.43 |
1,594 |
|
48,493 |
0.40 |
627 |
|
163,653 |
0.42 |
2,221 |
|
52% |
Stockpile |
United States |
100% |
|
— |
— |
— |
|
71,481 |
0.26 |
593 |
|
71,481 |
0.26 |
593 |
|
48% |
Total |
|
115,160 |
0.43 |
1,594 |
|
119,974 |
0.32 |
1,220 |
|
235,134 |
0.37 |
2,814 |
|
52% |
||
(1) The Mineral Reserve estimate was prepared in accordance with SK-1300
(2) The effective date of Mineral Reserves is July 1, 2025
(3) The Mineral Reserve estimate is based on a metal price assumption of $1,700/oz gold
(4) Gold cut-off grade for crush leach is 0.10g/t Au extractable cyanide soluble (factored for recovery) and run of mine leach is 0.069 g/t Au extractable cyanide soluble (factored for recovery)
(5) Metallurgical recoveries varies by lithology and oxidation state and ranges between 24.8% - 94.9%
(6) No mining dilution is applied to the grade of the Mineral Reserves. Dilution intrinsic to the Mineral Reserves estimate is considered sufficient to represent the mining selectivity considered
(7) Average bulk densities (in t/m3) were assigned based on lithologies and oxidation state
(8) The Property is 100% owned by SSRM
(9) Metals shown in this table are the contained metals in ore mined and processed
(10) All ounces reported represent troy ounces, and g/t represents a grade expressed in grams per metric tonne
(11) The point of reference for Mineral Reserves is the entry to the carbon columns in the processing facility
(12) Totals may vary due to rounding
(13) Leach Pad Inventory of 334koz represents work-in-process gold and is 100% recoverable over the LOM
(14) Project-to-Date combined Heap Leach Recovery is 53.6%, with VLF1 at 57.8% and VLF2 at 43.1%. Note that most of the remaining inventory to be leached is located in VLF2, therefore the apparent lower recovery
SSRM |
Measured |
Indicated |
Measured + Indicated |
Inferred |
||||||||||||||
Gold |
Country |
Share |
Tonnage |
Au Grade |
Gold |
Tonnage |
Au Grade |
Gold |
Tonnage |
Au Grade |
Gold |
Tonnage |
Au Grade |
Gold |
||||
(%) |
(kt) |
(g/t) |
(koz) |
(kt) |
(g/t) |
(koz) |
(kt) |
(g/t) |
(koz) |
(kt) |
(g/t) |
(koz) |
||||||
CC&V (OP) |
United States |
100% |
157,193 |
0.49 |
2,458 |
149,138 |
0.43 |
2,079 |
306,330 |
0.46 |
4,537 |
149,603 |
0.41 |
1,966 |
||||
Stockpile |
United States |
100% |
— |
— |
— |
38,514 |
0.25 |
308 |
38,514 |
0.25 |
308 |
— |
— |
— |
||||
| Total | 157,193 |
0.49 |
2,458 |
187,652 |
0.40 |
2,387 |
344,844 |
0.44 |
4,845 |
149,603 |
0.41 |
1,966 |
||||||
(1) The Mineral Resources estimate was prepared in accordance with SK-1300
(2) The effective date of Mineral Resources is July 1, 2025
(3) The Mineral Resource estimate is based on a metal price assumption of $2,000/oz gold
(4) Gold cut-off grade for crush leach is 0.10g/t Au extractable cyanide soluble (factored for recovery) and run of mine leach is 0.069 g/t Au extractable cyanide soluble (factored for recovery)
(5) Metallurgical recoveries varies by lithology and oxidation state and ranges between 24.8% - 94.9%
(6) No mining dilution is applied to the grade of the Mineral Resources
(7) Bulk densities (in t/m3) are average densities was assigned based on lithologies and oxidation state
(8) The Property is 100% owned by SSRM
(9) Metals shown in this table are contained metals
(10) All ounces reported represent troy ounces, and g/t represents grams per metric tonne
(11) The point of reference for Mineral Resources is the processing facility
(12) Totals may vary due to rounding
For Information regarding Marigold’s Mineral Reserves and Mineral Resources, refer to Item 2. Properties in the Company’s Annual Report on Form 10-K for the year ended December 31, 2024 filed on February 18, 2025 and the Technical Report Summary included as an exhibit to our Annual Report on Form 10-K.
Cautionary Note Regarding Non-GAAP Measures
We have included certain non-GAAP performance measures throughout this document. These performance measures are employed by us to measure our operating and economic performance internally and to assist in decision-making, as well as to provide key performance information to senior management. We believe that, in addition to conventional measures prepared in accordance with GAAP, certain investors and other stakeholders also use this information to evaluate our operating and financial performance; however, these non-GAAP performance measures do not have any standardized meaning. Accordingly, these performance measures are intended to provide additional information and should not be considered in isolation or as a substitute for measures of performance prepared in accordance with GAAP. Our definitions of our non-GAAP financial measures may not be comparable to similarly titled measures reported by other companies. These non-GAAP measures should be read in conjunction with our condensed consolidated interim financial statements.
Cash costs, AISC per ounce sold, and free cash flow are Non-GAAP Measures with no standardized definition under U.S. GAAP.
Non-GAAP Measure - Cash Costs and AISC
Cash Costs and All-In Sustaining Costs (“AISC”) per payable ounce of gold and respective unit cost measures are non-U.S. GAAP metrics developed by the World Gold Council to provide transparency into the costs associated with producing gold and provide a standard for comparison across the industry. The World Gold Council is a market development organization for the gold industry.
The Company uses cash costs per ounce of precious metals sold and AISC per ounce of precious metals to monitor its operating performance internally. The most directly comparable measure prepared in accordance with GAAP is cost of sales. The Company believes this measure provides investors and analysts with useful information about its underlying cash costs of operations and the impact of byproduct credits on its cost structure. The Company also believes it is a relevant metric used to understand its operating profitability. When deriving the cost of sales associated with an ounce of precious metal, the Company includes by-product credits, which allows management and other stakeholders to assess the net costs of gold and silver production.
AISC includes total cost of sales incurred at the Company's mining operations, which forms the basis of cash costs. Additionally, the Company includes sustaining capital expenditures, sustaining mine-site exploration and evaluation costs, reclamation cost accretion and amortization, and general and administrative expenses. This measure seeks to reflect the ongoing cost of gold and silver production from current operations; therefore, growth capital is excluded. The Company determines sustaining capital to be capital expenditures that are necessary to maintain current production and execute the current mine plan. The Company determines growth capital to be those payments used to develop new operations or related to projects at existing operations where those projects will materially benefit the operation.
The Company believes that AISC provides additional information to management and stakeholders that provides visibility to better define the total costs associated with production and better understanding of the economics of the Company's operations and performance compared to other producers. In deriving the number of ounces of precious metal sold, the Company considers the physical ounces available for sale after the treatment and refining process, commonly referred to as payable metal, as this is what is sold to third parties.
The following tables provide a reconciliation of Cost of sales to cash costs and AISC used in the 2025 CC&V TRS:
(in thousands, unless otherwise noted) |
|
2026 – 2028 |
|
2026 – 2030 |
||||
Cost of sales (GAAP) (9) |
|
$ |
874,266 |
|
$ |
1,431,736 |
||
Inventory movements (non-Cash) |
|
$ |
(112,105) |
|
$ |
(183,285) |
||
Cost of sales including non-cash inventory movements (non-GAAP) |
|
$ |
762,161 |
|
$ |
1,248,451 |
||
Treatment and refining charges |
|
$ |
508 |
|
$ |
788 |
||
Cash costs (non-GAAP) |
|
$ |
762,670 |
|
$ |
1,249,239 |
||
Sustaining capital |
|
$ |
97,873 |
|
$ |
143,022 |
||
Reclamation cost accretion and amortization |
|
$ |
8,119 |
|
$ |
9,908 |
||
Total AISC (non-GAAP) |
|
$ |
868,662 |
|
$ |
1,402,170 |
||
|
|
|
|
|
|
|
||
Gold sold (oz) |
|
|
|
423,615 |
|
|
|
656,665 |
|
|
|
|
|
|
|
||
Cost of sales per gold ounces sold |
|
$ |
1,799 |
|
$ |
1,901 |
||
Cash cost per gold ounce sold |
|
$ |
1,800 |
|
$ |
1,902 |
||
AISC per gold ounce sold |
|
$ |
2,051 |
|
$ |
2,135 |
||
(9) Excludes depreciation, depletion, and amortization. |
||||||||
Realized Cash Calculation
The following table provides a calculation of realized cash for Marigold since acquisition on April 4, 2014 through September 30, 2025 and for CC&V since acquisition on February 28, 2025 through September 30, 2025:
(in thousands of US dollars) (10) |
|
|
Marigold |
|
|
Seabee |
|
|
CC&V |
Revenue (GAAP) |
|
$ |
3,970 |
|
$ |
1,525 |
|
$ |
283 |
Cost of Sales |
|
$ |
(2,190) |
|
$ |
(590) |
|
$ |
(107) |
Exploration and Evaluation Expenditures |
|
$ |
(110) |
|
$ |
(105) |
|
$ |
(9) |
Care & Maintenance (Cash) |
|
$ |
— |
|
$ |
(25) |
|
$ |
— |
Capital Expenditures |
|
$ |
(650) |
|
$ |
(285) |
|
$ |
(31) |
Realized Cash Before Taxes (non-GAAP) |
|
$ |
1,020 |
|
$ |
525 |
|
$ |
136 |
Taxes (11) |
|
$ |
(135) |
|
$ |
(130) |
|
$ |
(22) |
Realized Cash After Taxes (non-GAAP) |
|
$ |
885 |
|
$ |
395 |
|
$ |
114 |
(10) Figures may not add due to rounding |
|||||||||
(11) Represents federal and state taxes paid since acquisition |
|||||||||
2025 CC&V TRS Life of Mine Plan – Cash Flow Model (12)
Operating Summary |
Total / Avg |
Jul 2025 |
2026 |
|
2027 |
|
2028 |
|
2029 |
|
2030 |
|
2031 |
|
2032 |
|
2033 |
|
2034 |
|
2035 |
|
2036 |
|
2037 |
|
2038 |
|
2039 |
|
2040 |
|
2041 |
|
2042 |
|
2043 |
|
2044 |
|
2045 |
|
2046 |
|
2047 |
|
2048 |
|
2049 |
|
2050 |
|
||
Total Ore Mined (kt) |
226,187 |
|
11,718 |
|
21,155 |
|
19,981 |
|
19,894 |
|
18,144 |
|
18,162 |
|
19,270 |
|
21,772 |
|
21,772 |
|
21,739 |
|
19,541 |
|
13,039 |
|
— |
|
— |
|
— |
|
— |
|
— |
|
— |
|
— |
|
— |
|
— |
|
— |
|
— |
|
— |
|
— |
|
— |
|
Total Waste Mined (kt) |
146,362 |
|
6,043 |
|
15,947 |
|
20,633 |
|
20,098 |
|
19,571 |
|
18,125 |
|
17,018 |
|
9,124 |
|
7,380 |
|
4,335 |
|
7,718 |
|
370 |
|
— |
|
— |
|
— |
|
— |
|
— |
|
— |
|
— |
|
— |
|
— |
|
— |
|
— |
|
— |
|
— |
|
— |
|
Total Material Mined (kt) |
372,549 |
|
17,761 |
|
37,102 |
|
40,614 |
|
39,991 |
|
37,715 |
|
36,287 |
|
36,287 |
|
30,897 |
|
29,153 |
|
26,073 |
|
27,260 |
|
13,409 |
|
— |
|
— |
|
— |
|
— |
|
— |
|
— |
|
— |
|
— |
|
— |
|
— |
|
— |
|
— |
|
— |
|
— |
|
Stripping Ratio (W:O) |
0.6 |
|
0.5 |
|
0.8 |
|
1.0 |
|
1.0 |
|
1.1 |
|
1.0 |
|
0.9 |
|
0.4 |
|
0.3 |
|
0.2 |
|
0.4 |
|
0.0 |
|
— |
|
— |
|
— |
|
— |
|
— |
|
— |
|
— |
|
— |
|
— |
|
— |
|
— |
|
— |
|
— |
|
— |
|
Total Ore Processed (kt) |
226,187 |
|
11,718 |
|
21,155 |
|
19,981 |
|
19,894 |
|
18,144 |
|
18,162 |
|
19,270 |
|
21,772 |
|
21,772 |
|
21,739 |
|
19,541 |
|
13,039 |
|
— |
|
— |
|
— |
|
— |
|
— |
|
— |
|
— |
|
— |
|
— |
|
— |
|
— |
|
— |
|
— |
|
— |
|
Gold Grade, Stacked (g/t) |
0.39 |
|
0.36 |
|
0.36 |
|
0.39 |
|
0.38 |
|
0.42 |
|
0.44 |
|
0.43 |
|
0.48 |
|
0.32 |
|
0.36 |
|
0.37 |
|
0.36 |
|
— |
|
— |
|
— |
|
— |
|
— |
|
— |
|
— |
|
— |
|
— |
|
— |
|
— |
|
— |
|
— |
|
— |
|
Average Recovery, Gold (%) |
52 |
% |
56 |
% |
64 |
% |
51 |
% |
50 |
% |
46 |
% |
48 |
% |
52 |
% |
51 |
% |
56 |
% |
53 |
% |
49 |
% |
41 |
% |
— |
|
— |
|
— |
|
— |
|
— |
|
— |
|
— |
|
— |
|
— |
|
— |
|
— |
|
— |
|
— |
|
— |
|
Payable Gold, Total (koz) |
1,795 |
|
60 |
|
141 |
|
137 |
|
146 |
|
119 |
|
114 |
|
131 |
|
141 |
|
96 |
|
76 |
|
39 |
|
56 |
|
53 |
|
50 |
|
48 |
|
45 |
|
43 |
|
41 |
|
39 |
|
37 |
|
35 |
|
33 |
|
31 |
|
30 |
|
28 |
|
27 |
|
|
|
|
|
|
|
|
|
|
|
|
|
|
|
|
|
|
|
|
|
|
|
|
|
|
|
|
|
|||||||||||||||||||||||||||
Financial Summary |
|
|
|
|
|
|
|
|
|
|
|
|
|
|
|
|
|
|
|
|
|
|
|
|
|
|
|
|||||||||||||||||||||||||||
Gold Gross Revenue ($M) |
$5,817 |
|
$200 |
|
$534 |
|
$507 |
|
$495 |
|
$386 |
|
$358 |
|
$407 |
|
$435 |
|
$297 |
|
$235 |
|
$121 |
|
$173 |
|
$164 |
|
$156 |
|
$148 |
|
$140 |
|
$133 |
|
$126 |
|
$120 |
|
$113 |
|
$108 |
|
$102 |
|
$97 |
|
$92 |
|
$87 |
|
$83 |
|
Operating Costs ($M) |
($3,401 |
) |
($141 |
) |
($293 |
) |
($289 |
) |
($292 |
) |
($272 |
) |
($285 |
) |
($283 |
) |
($268 |
) |
($256 |
) |
($241 |
) |
($236 |
) |
($155 |
) |
($71 |
) |
($41 |
) |
($29 |
) |
($27 |
) |
($25 |
) |
($24 |
) |
($23 |
) |
($22 |
) |
($22 |
) |
($22 |
) |
($21 |
) |
($21 |
) |
($21 |
) |
($20 |
) |
Refining and Freight Cost ($M) |
($2 |
) |
($0 |
) |
($0 |
) |
($0 |
) |
($0 |
) |
($0 |
) |
($0 |
) |
($0 |
) |
($0 |
) |
($0 |
) |
($0 |
) |
($0 |
) |
($0 |
) |
($0 |
) |
($0 |
) |
($0 |
) |
($0 |
) |
($0 |
) |
($0 |
) |
($0 |
) |
($0 |
) |
($0 |
) |
($0 |
) |
($0 |
) |
($0 |
) |
($0 |
) |
($0 |
) |
EBITDA ($M) |
$2,414 |
|
$59 |
|
$241 |
|
$218 |
|
$203 |
|
$114 |
|
$72 |
|
$123 |
|
$167 |
|
$41 |
|
($7 |
) |
($115 |
) |
$19 |
|
$93 |
|
$115 |
|
$119 |
|
$113 |
|
$108 |
|
$102 |
|
$97 |
|
$91 |
|
$86 |
|
$80 |
|
$75 |
|
$71 |
|
$66 |
|
$62 |
|
Depreciation & Depletion ($M) |
($1,085 |
) |
($31 |
) |
($96 |
) |
($105 |
) |
($109 |
) |
($74 |
) |
($55 |
) |
($82 |
) |
($105 |
) |
($39 |
) |
($30 |
) |
($25 |
) |
($22 |
) |
($41 |
) |
($36 |
) |
($32 |
) |
($28 |
) |
($25 |
) |
($22 |
) |
($20 |
) |
($18 |
) |
($17 |
) |
($16 |
) |
($15 |
) |
($14 |
) |
($15 |
) |
($12 |
) |
Earnings Before Taxes ($M) |
$1,329 |
|
$29 |
|
$145 |
|
$112 |
|
$94 |
|
$40 |
|
$17 |
|
$41 |
|
$62 |
|
$2 |
|
($37 |
) |
($140 |
) |
($3 |
) |
$52 |
|
$79 |
|
$87 |
|
$85 |
|
$83 |
|
$81 |
|
$77 |
|
$72 |
|
$68 |
|
$64 |
|
$60 |
|
$56 |
|
$52 |
|
$50 |
|
Federal & State Tax ($M) |
($203 |
) |
($6 |
) |
($31 |
) |
($24 |
) |
($21 |
) |
($9 |
) |
($4 |
) |
($9 |
) |
($14 |
) |
($0 |
) |
— |
|
— |
|
— |
|
— |
|
— |
|
— |
|
— |
|
— |
|
($6 |
) |
($13 |
) |
($12 |
) |
($12 |
) |
($11 |
) |
($11 |
) |
($10 |
) |
($7 |
) |
($6 |
) |
Net Income ($M) |
$1,126 |
|
$23 |
|
$114 |
|
$88 |
|
$74 |
|
$31 |
|
$14 |
|
$33 |
|
$49 |
|
$2 |
|
($37 |
) |
($140 |
) |
($3 |
) |
$52 |
|
$79 |
|
$87 |
|
$85 |
|
$83 |
|
$75 |
|
$64 |
|
$60 |
|
$56 |
|
$53 |
|
$49 |
|
$46 |
|
$45 |
|
$44 |
|
|
|
|
|
|
|
|
|
|
|
|
|
|
|
|
|
|
|
|
|
|
|
|
|
|
|
|
|
|||||||||||||||||||||||||||
AT Operating Cash Flow ($M) |
$2,211 |
|
$53 |
|
$210 |
|
$194 |
|
$183 |
|
$105 |
|
$69 |
|
$115 |
|
$154 |
|
$41 |
|
($7 |
) |
($115 |
) |
$19 |
|
$93 |
|
$115 |
|
$119 |
|
$113 |
|
$108 |
|
$96 |
|
$84 |
|
$79 |
|
$74 |
|
$70 |
|
$64 |
|
$61 |
|
$60 |
|
$56 |
|
Total Capital ($M) |
($939 |
) |
($42 |
) |
($90 |
) |
($83 |
) |
($29 |
) |
($32 |
) |
($48 |
) |
($26 |
) |
($30 |
) |
($19 |
) |
($18 |
) |
($43 |
) |
($28 |
) |
($29 |
) |
($29 |
) |
($29 |
) |
($54 |
) |
($38 |
) |
($25 |
) |
($19 |
) |
($18 |
) |
($15 |
) |
($16 |
) |
($10 |
) |
($10 |
) |
($23 |
) |
($23 |
) |
AT Free Cash Flow ($M) |
$1,272 |
|
$12 |
|
$120 |
|
$111 |
|
$153 |
|
$73 |
|
$20 |
|
$89 |
|
$124 |
|
$22 |
|
($24 |
) |
($158 |
) |
($10 |
) |
$64 |
|
$86 |
|
$89 |
|
$59 |
|
$69 |
|
$72 |
|
$65 |
|
$61 |
|
$58 |
|
$54 |
|
$54 |
|
$50 |
|
$37 |
|
$33 |
|
|
|
|
|
|
|
|
|
|
|
|
|
|
|
|
|
|
|
|
|
|
|
|
|
|
|
|
|
|||||||||||||||||||||||||||
Non-GAAP Reconciliation |
|
|
|
|
|
|
|
|
|
|
|
|
|
|
|
|
|
|
|
|
|
|
|
|
|
|
|
|||||||||||||||||||||||||||
Cost of Sales ($M, GAAP) |
$3,401 |
|
$141 |
|
$293 |
|
$289 |
|
$292 |
|
$272 |
|
$285 |
|
$283 |
|
$268 |
|
$256 |
|
$241 |
|
$236 |
|
$155 |
|
$71 |
|
$41 |
|
$29 |
|
$27 |
|
$25 |
|
$24 |
|
$23 |
|
$22 |
|
$22 |
|
$22 |
|
$21 |
|
$21 |
|
$21 |
|
$20 |
|
Treatment & Refining ($M) |
$2 |
|
$0 |
|
$0 |
|
$0 |
|
$0 |
|
$0 |
|
$0 |
|
$0 |
|
$0 |
|
$0 |
|
$0 |
|
$0 |
|
$0 |
|
$0 |
|
$0 |
|
$0 |
|
$0 |
|
$0 |
|
$0 |
|
$0 |
|
$0 |
|
$0 |
|
$0 |
|
$0 |
|
$0 |
|
$0 |
|
$0 |
|
Cash Costs ($M, non-GAAP) |
$3,403 |
|
$141 |
|
$293 |
|
$289 |
|
$292 |
|
$272 |
|
$286 |
|
$283 |
|
$268 |
|
$256 |
|
$242 |
|
$236 |
|
$155 |
|
$71 |
|
$41 |
|
$29 |
|
$27 |
|
$25 |
|
$24 |
|
$23 |
|
$22 |
|
$22 |
|
$22 |
|
$21 |
|
$21 |
|
$21 |
|
$20 |
|
Sustaining Capital ($M) |
$263 |
|
$23 |
|
$43 |
|
$32 |
|
$22 |
|
$23 |
|
$23 |
|
$17 |
|
$24 |
|
$18 |
|
$17 |
|
$13 |
|
$1 |
|
$1 |
|
$1 |
|
$1 |
|
$1 |
|
$1 |
|
$1 |
|
$1 |
|
$1 |
|
$1 |
|
$1 |
|
$1 |
|
$1 |
|
$1 |
|
$1 |
|
Reclamation ($M) |
$517 |
|
$2 |
|
$5 |
|
$2 |
|
$1 |
|
$1 |
|
$1 |
|
$2 |
|
$0 |
|
$0 |
|
$1 |
|
$30 |
|
$27 |
|
$29 |
|
$29 |
|
$29 |
|
$53 |
|
$38 |
|
$24 |
|
$19 |
|
$18 |
|
$15 |
|
$16 |
|
$10 |
|
$10 |
|
$22 |
|
$23 |
|
AISC ($M, non-GAAP) |
$4,184 |
|
$166 |
|
$342 |
|
$324 |
|
$315 |
|
$295 |
|
$309 |
|
$303 |
|
$292 |
|
$275 |
|
$259 |
|
$279 |
|
$183 |
|
$101 |
|
$70 |
|
$59 |
|
$81 |
|
$64 |
|
$49 |
|
$42 |
|
$41 |
|
$37 |
|
$38 |
|
$31 |
|
$31 |
|
$43 |
|
$43 |
|
(12) All cash flow figures are presented after tax ("AT"). Free cash flow is calculated as operating cash flow less capital costs. The summary above does not include non-cash inventory adjustments and other minor non-cash items that impact the Company’s calculation of cash costs and AISC. |
||||||||||||||||||||||||||||||||||||||||||||||||||||||
View source version on businesswire.com: https://www.businesswire.com/news/home/20251109711532/en/
Contacts
For more information, please visit: www.ssrmining.com.
E-Mail: invest@ssrmining.com
Phone: +1 (888) 338-0046