- AXT Inc. (AXTI) has surged 2,386.88% over the past 52 weeks, recently hitting an all-time high of $46.81.
- AXTI maintains strong technical momentum, with a 100% “Buy” Barchart opinion.
- Fundamentals show strong revenue and earnings growth estimates.
- Despite bullish technicals, price appreciation is decelerating, short interest is rising, and analyst price targets lag the current price.
Author’s Note: AXT Inc. was featured on Nov. 12 when it scored a 3-year high at $11.88. Friday it closed at $37.90. Nice gain if you bought back then.
Today’s Featured Stock
Valued at $2.10 billion, AXT Inc. (AXTI) designs, develops, manufactures and distributes high-performance compound semiconductor substrates, as well as opto-electronic semiconductor devices such as high-brightness light emitting devices and vertical cavity surface emitting lasers.
What I’m Watching
I found today’s Chart of the Day by using Barchart’s powerful screening functions to sort for stocks with the highest technical buy signals; superior current momentum in both strength and direction; and a Trend Seeker “buy” signal. I then used Barchart’s Flipcharts feature to review the charts for consistent price appreciation. AXTI checks those boxes. Since the Trend Seeker issued a new “Buy” on Feb. 6, shares are up 64.09%.
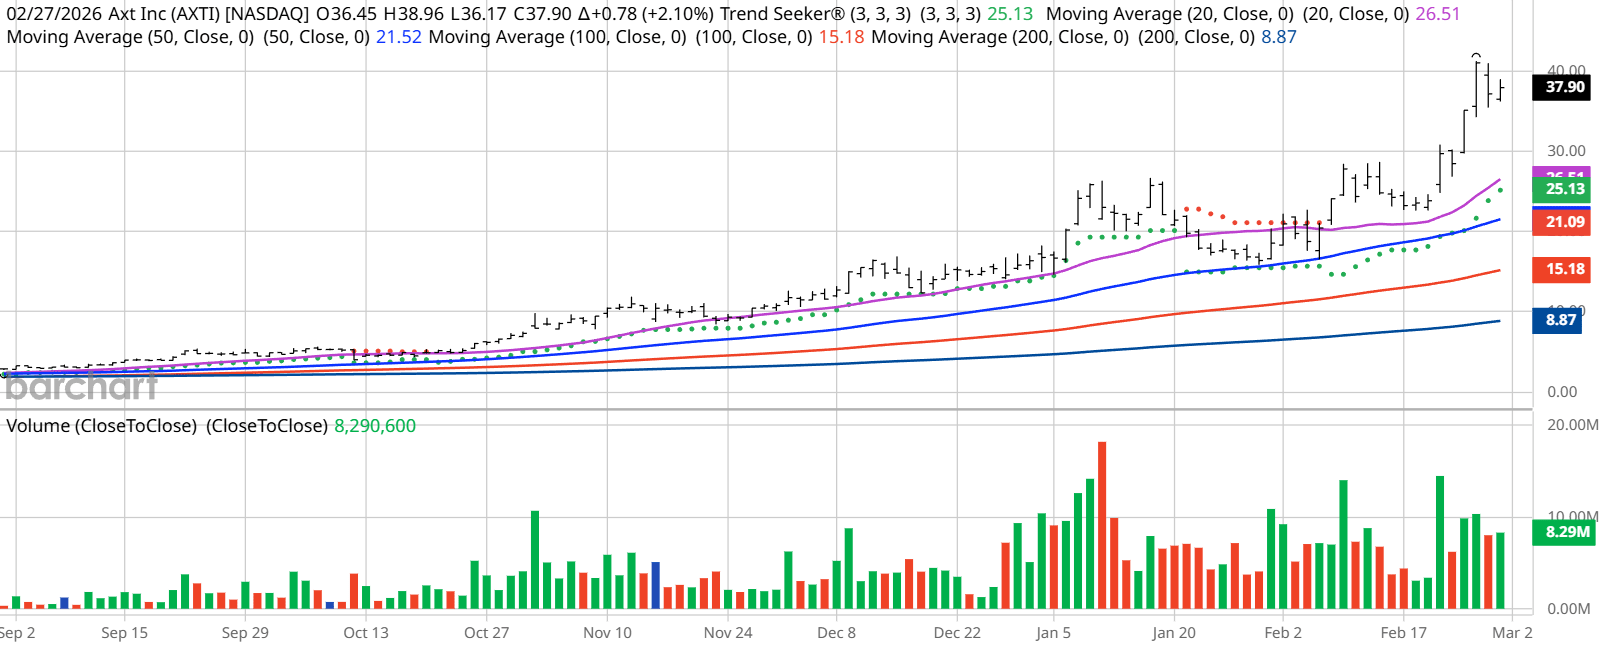
Barchart Technical Indicators for AXT Inc.
Editor’s Note: The technical indicators below are updated live during the session every 20 minutes and can therefore change each day as the market fluctuates. The indicator numbers shown below therefore may not match what you see live on the Barchart.com website when you read this report. These technical indicators form the Barchart Opinion on a particular stock.
AXT Inc. scored an all-time high of $46.81 on March 2.
- AXTI has a Weighted Alpha of +1,684.76.
- AXT Inc. has a 100% “Buy” opinion from Barchart.
- The stock has gained 2,386.88% over the past 52 weeks.
- AXT Inc. has its Trend Seeker “Buy” signal intact.
- The stock recently traded at $42.79 with a 50-day moving average of $22.11.
- AXTI has made 10 new highs and is up 98.57% over the past month.
- Relative Strength Index (RSI) is at 72.67.
- There’s a technical support level around $36.39.
Don’t Forget the Fundamentals
- $2.10 billion market capitalization.
- Revenue is expected to grow 41.87% this year and another 41.19% next year.
- Earnings are estimated to increase 100.98% this year and an additional 11,566.75% next year.
Analyst and Investor Sentiment on AXT Inc.
- The Wall Street analysts followed by Barchart gave the stock 3 “Strong Buy” and 3 “Hold” opinions with price targets between $21 and $35. Note that analysts’ price targets are below Friday’s close.
- Value Line rates the stock “Above Average.”
- CFRA’s MarketScope rates the stock a “Sell.”
- Morningstar thinks the stock is 78% overvalued with a fair value of $21.21, way below Friday’s close.
- 1,083 investors following the stock on Motley Fool think it will beat the market while 78 think it won’t.
- 7,390 investors are following the stock on Seeking Alpha, which rates it a “Hold.”
- Short interest is 8.07% of the float with 1.00 day to cover the float.
The Bottom Line on AXT Inc.
One of the technical comparisons I like to use to see if the party is over is to compare the Weighted Alpha, which is 1,684.76, to the 52-week price change, which is 2,386.88%. Although when we look at the chart and the Barchart Opinion we still see a rise in price, you can see that the price increases are decelerating. Short Interest at 8.07 of the float is starting to get high.
How much more room for price increase is there? That’s anyone’s guess. Follow the disclosure below.
Additional disclosure: The Barchart Chart of the Day highlights stocks that are experiencing exceptional current price appreciation. They are not intended to be buy recommendations as these stocks are extremely volatile and speculative. Should you decide to add one of these stocks to your investment portfolio it is highly suggested you follow a predetermined diversification and moving stop loss discipline that is consistent with your personal investment risk tolerance.
On the date of publication, Jim Van Meerten did not have (either directly or indirectly) positions in any of the securities mentioned in this article. All information and data in this article is solely for informational purposes. For more information please view the Barchart Disclosure Policy here.
More news from Barchart