
Deere & Company (DE) has been leveraging unique partnerships and improving product lines to support ongoing growth and market dominance. Recently, it revealed a groundbreaking contract with SpaceX to supply satellite communications service to farmers utilizing Starlink, SpaceX's aerospace network. Deere & Company believes this industry-first partnership will boost productivity, profitability, and sustainability for John Deere clients, who, in turn, provide food, fuel, and fiber to their communities.
Coming to its financial performance, Deere & Company reported a net income of $2.37 billion, or $8.26 per share, for the quarter ended October 29, 2023. This compares to a net income of $2.25 billion, or $7.44 per share, for the same quarter in the previous year.
However, global net sales and revenues dropped by 1% year-over-year, reaching $15.41 billion in the fourth quarter of 2023. The company posted net sales of $13.80 billion for the quarter and $55.57 billion for the year, compared to $14.35 billion and $47.92 billion in 2022, respectively.
For fiscal 2024, the net income attributable to Deere & Company is projected to range between $7.75 billion and $8.25 billion. “While our end markets will fluctuate, we remain focused on disciplined execution and strategically investing in solutions that drive customer value,” said John C. May, chairman and chief executive officer.
On the other hand, Wall Street analysts expect DE’s revenue to decline 9.4% year-over-year to $10.33 billion in the quarter ended January 2024. Also, its EPS is expected to come in at $5.25, down 19.8% year-over-year.
Given the analysts' subdued estimates, it might be advantageous for potential investors to await a more favorable entry point for investment. The company plans to release its first-quarter 2024 financial results on February 15. A detailed examination of the company's crucial performance indicators could provide valuable insight.
Deere & Company Exhibits Sustained Growth Despite Fluctuations: A Comprehensive Financial Analysis (2021-2023)
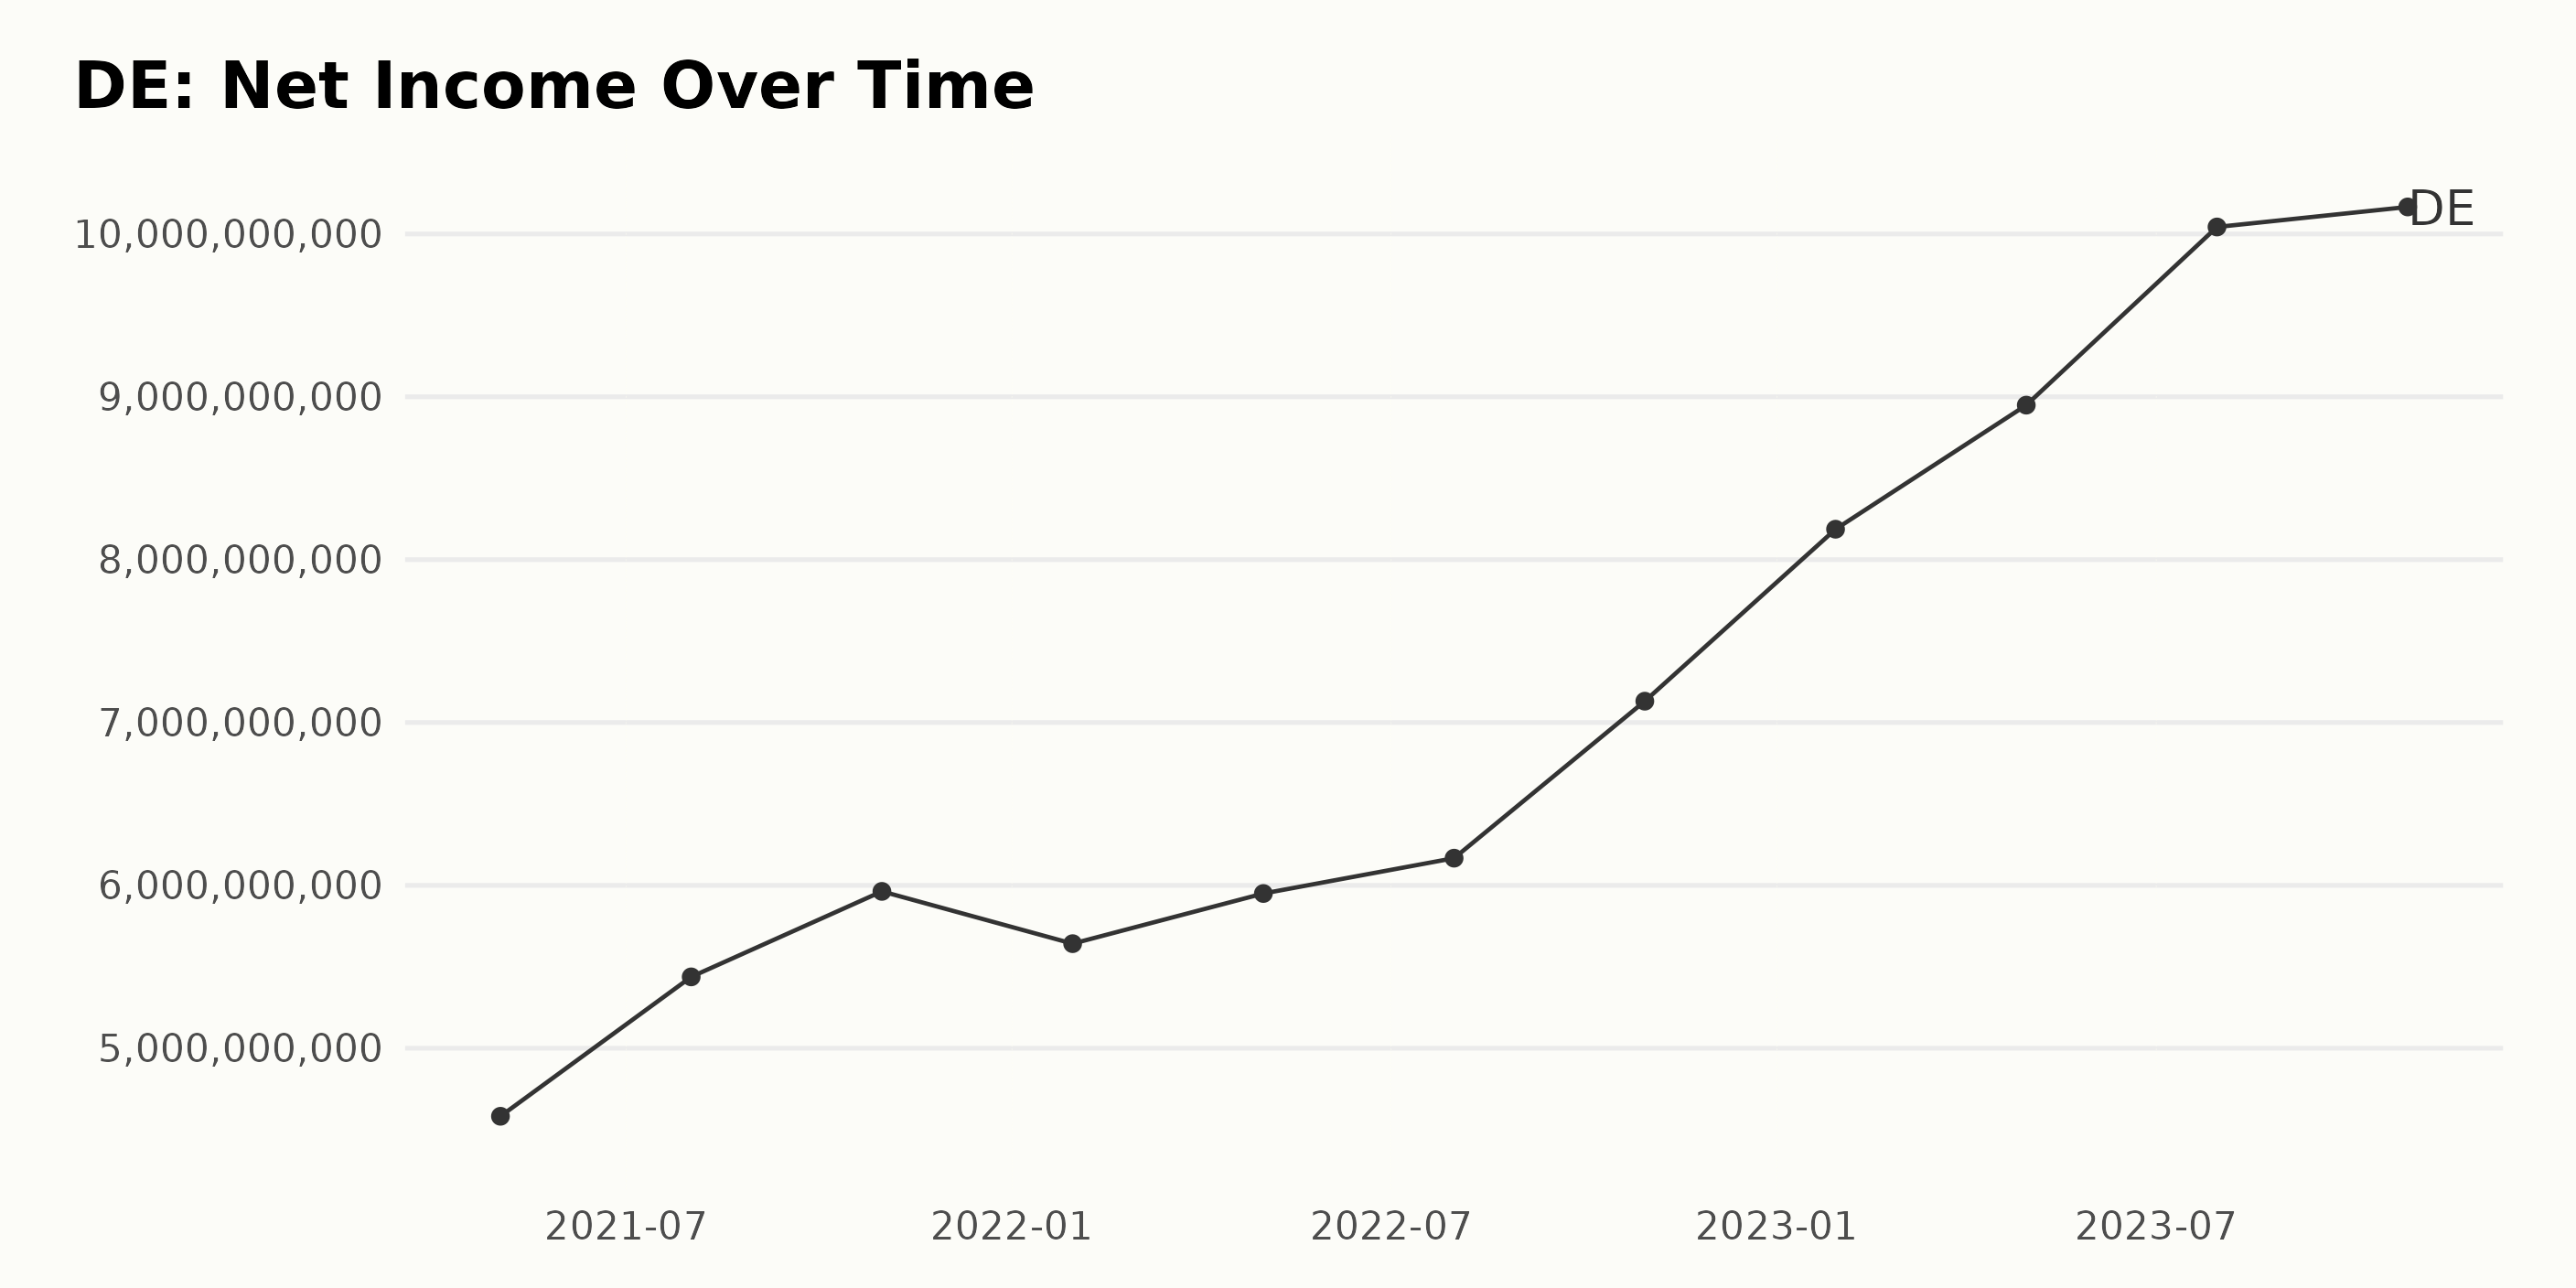
The reported trailing-12-month Net Income of DE exhibits an overall growing trend across the given set of data.
- In May 2021, the Net Income was $4.58 billion.
- Then it increased to $5.44 billion in August 2021 and slightly further to $5.96 billion by October 2021.
- It decreased somewhat to $5.64 billion in January 2022 but then grew consistently reaching $5.95 billion in May 2022 and $6.17 billion in July 2022.
- There was a noticeable increase to $7.13 billion in October 2022 and to $8.19 billion by January 2023.
- The growth continued with the Net Income reaching $8.95 billion in April 2023 and recorded a significant raise to $10.04 billion in July 2023. Finally, as of the last value in the series, the Net Income of DE was $10.17 billion in October 2023.
This represents growth of approximately 122% when measured from the first reported value of $4.58 billion in May 2021. It indicates a strong upward trajectory for DE's performance over this period, with the most significant increments registered from 2022 to 2023. The data also reveals some fluctuations, but the general pattern is one of sustained growth.
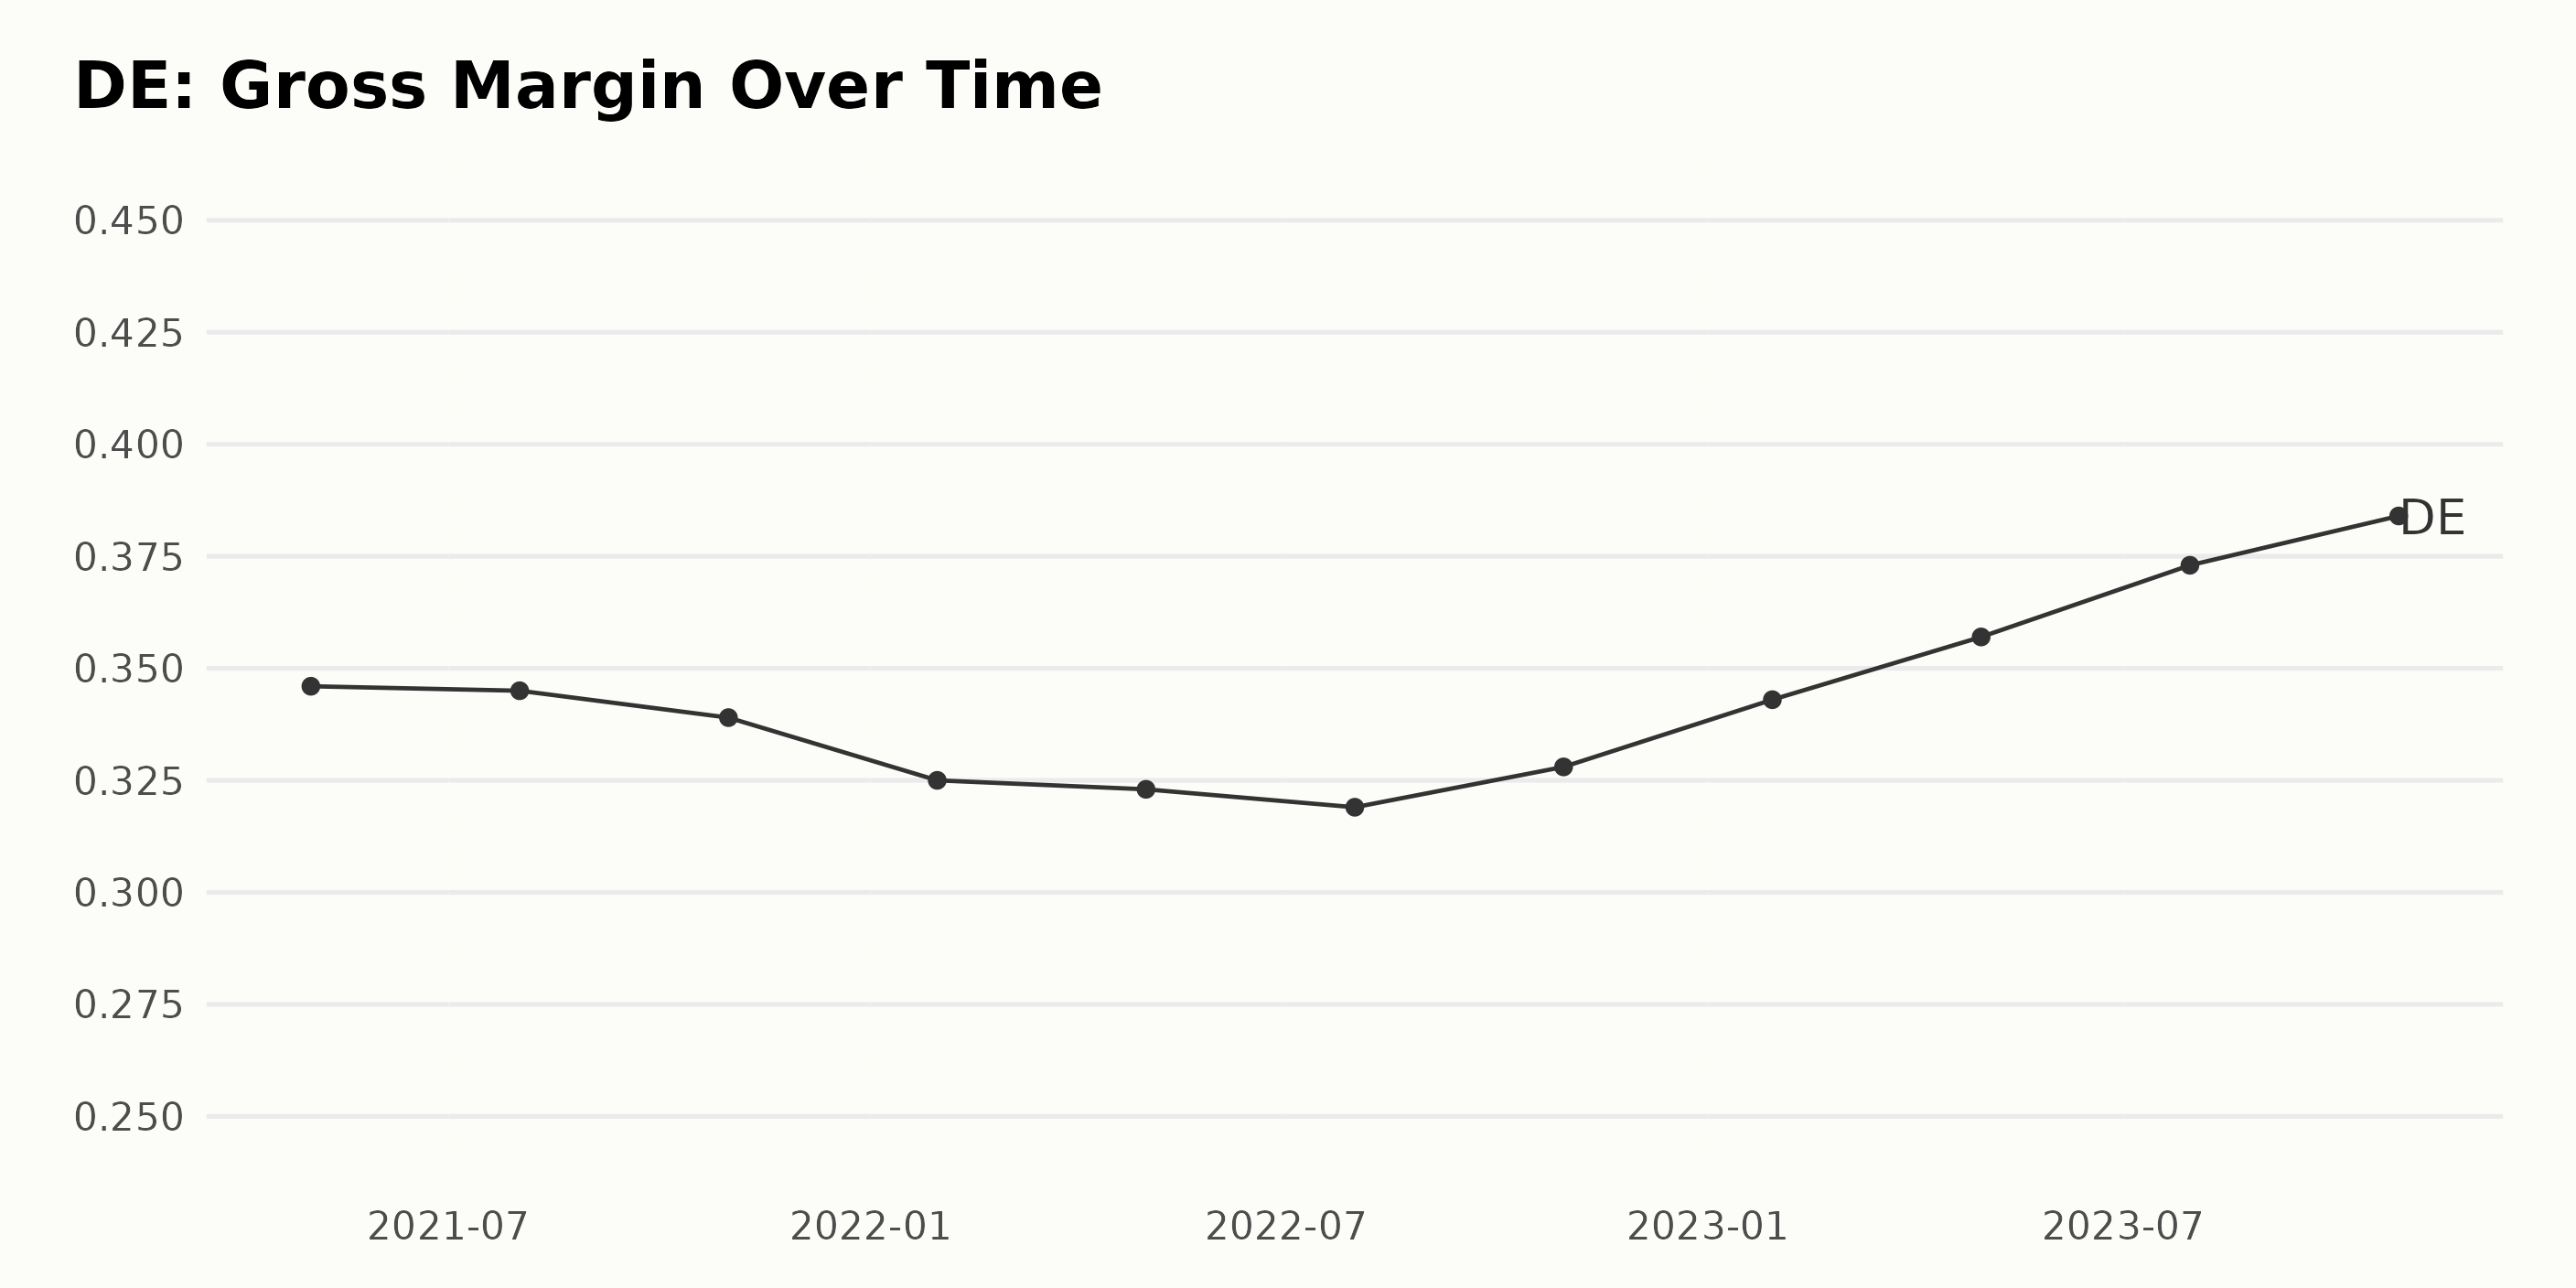
The Gross Margin of DE has shown both trend and fluctuations over the given period.
- Starting from May 2021 with a Gross Margin of 34.6%, a slight drop was seen by August 2021 when it fell to 34.5%.
- There was a downward trend between August 2021 and July 2022, where the Gross Margin slid from 34.5% to 31.9%. This accounted for a decline rate of about 7.5% over ten months.
- In October 2022, we could observe an upturn, Gross Margin slightly increased to 32.8%.
- From October 2022 onward, DE enjoyed a growth phase with Gross Margin steadily climbing. By October 2023, it reached its peak at 38.4%. This amount represented an impressive increase of approximately 17% from its value one year prior.
In conclusion, while there have been both rises and drops during this time frame, the overall growth from the first recorded value in May 2021 (34.6%) to the last value in October 2023 (38.4%) shows a positive increase of around 11%. Therefore, despite some periodic dips, recent data indicates a generally positive trend for the Gross Margin of Deere & Company over these years.
The asset turnover of DE has shown an overall upward trend from May 2021 to October 2023. Here's a summary of the important fluctuations and the final growth rate:
- In May 2021, the company started at an Asset Turnover of 0.52.
- By August 2021, there was a slight increase to 0.55.
- The asset turnover remained relatively stable, hovering around 0.55 until January 2022.
- From May 2022, we begin to see a more pronounced upward trend, with the Asset Turnover rising to 0.56 in May 2022, and further to 0.58 by July 2022.
- As of October 2022, it reached its peak value of 0.62.
- The upward trend continued into early 2023 with the Asset Turnover reaching 0.65 in April 2023.
- The value slightly dropped to 0.64 in July 2023, then noticeably to 0.62 by October 2023.
Calculating from the first value in May 2021 (0.52) to the last recorded value in October 2023 (0.62), the growth rate of the Asset Turnover at Deere & Company (DE) over this period is approximately 19.23%. Keep in mind that while there has been overall growth, the fluctuating values suggest varying degrees of efficiency in the company's use of its assets to generate sales over this time frame.

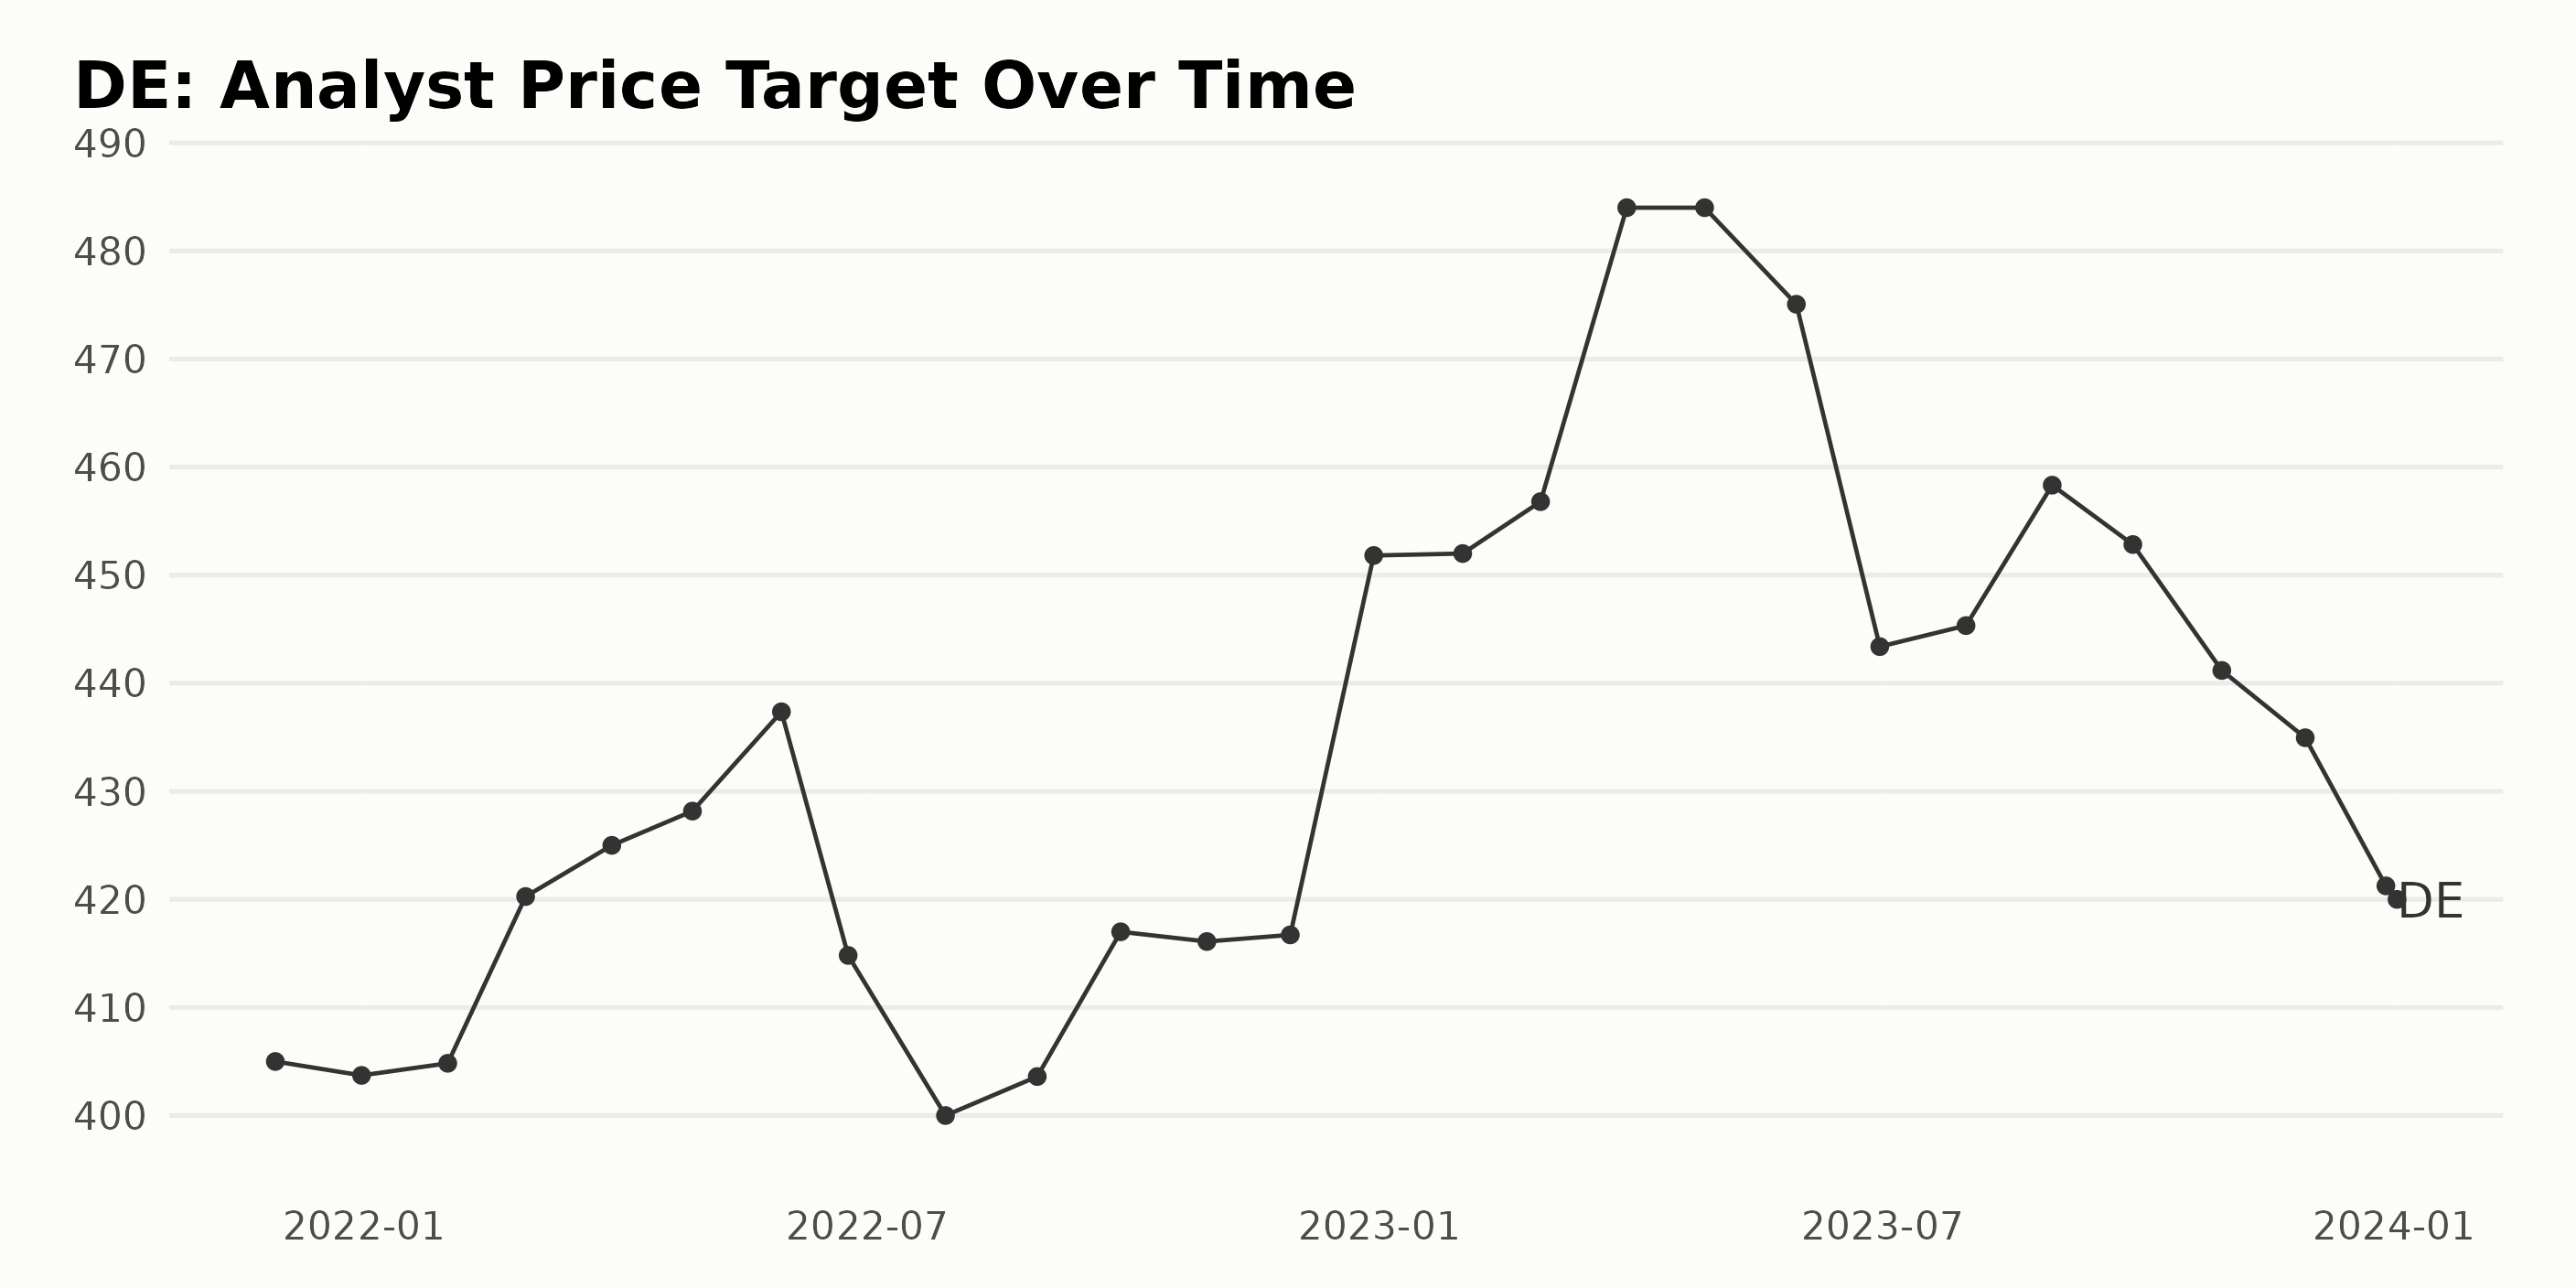
The Analyst Price Target of DE shows a general upward trend from November 2021 to January 2023, with some fluctuation. The Price Target then began to exhibit declining trend with minor increases until December 2023, following which it maintained a persistent decline until January 2024.
- The Analyst Price Target in November 2021 was $405.
- End of year in December 2022 had a slight decline to $403.71 but it increased the next month (January 2022) back to $404.83.
- A sharp increase was experienced in February 2022 at $420.26 and kept rising until May, peaking at $437.36.
- There was a downturn observed in June 2022, which fell to $414.81 and continued to fall to its lowest for that year in July at $400.
- The price target again started to climb, snaking through rest of 2022 and peaked again in January 2023 at $452, which was the height it reached throughout the available data series.
- March 2023 saw a high value of $484, after which it declined to $475.07 in May 2023 and further to $443.39 in June 2023.
- August 2023 again saw an increase of $458.33, but the general downtrend continued afterwards.
- The lowest price target value recorded in the series was reached in January 2024 at $420
Overall, between November 2021 and January 2024, the price target increased by approximately 3.7%.
Deere & Company's Share Price Trends: A Roller Coaster Ride from August 2023 to February 2024
Examining the provided data on Deere & Company's (DE) share prices, several trends and growth rates can be identified:
- On August 18, 2023, DE's share price began at $410.37. Subsequently, there was a slight dip to $389.37 by August 25, marking a decrease of approximately 5.1% over this week.
- In the first week of September 2023, the share prices witnessed an upward trend, attaining a peak value of $411.11 on September 8. However, a decreasing trend ensued from this point, hitting a low of $375.12 by October 6th, pointing to a drop rate of approximately 8.8% in this month.
- The prices experienced minor fluctuations through October 2023, but recorded a consistent decline from November to the first week of December, plunging to $363.96. This signifies a fall of about 1.9% over this month.
- A positive shift in the trend was seen as the share prices bounced back to $391.40 on December 22, marking more than a 7.6% increase in two weeks. The high price continued till the end of 2023 with the value of $400.52.
- Starting 2024, the share prices appeared to demote slightly as of January 19, where the share price recorded was $381.71, about a 4.7% decrease compared to the previous month's end. It subsequently inclined to $394.38 by February 2, marking again an upsurge of roughly 3.3% in two weeks.
In summary, the share prices of Deere & Company (DE) saw both ups and downs over the period from August 2023 to February 2024. But the overall trend can be interpreted as a moderately decelerating one from its start till December 2023, with prices fluctuating more after that leading to the first weeks of 2024. Here is a chart of DE's price over the past 180 days.

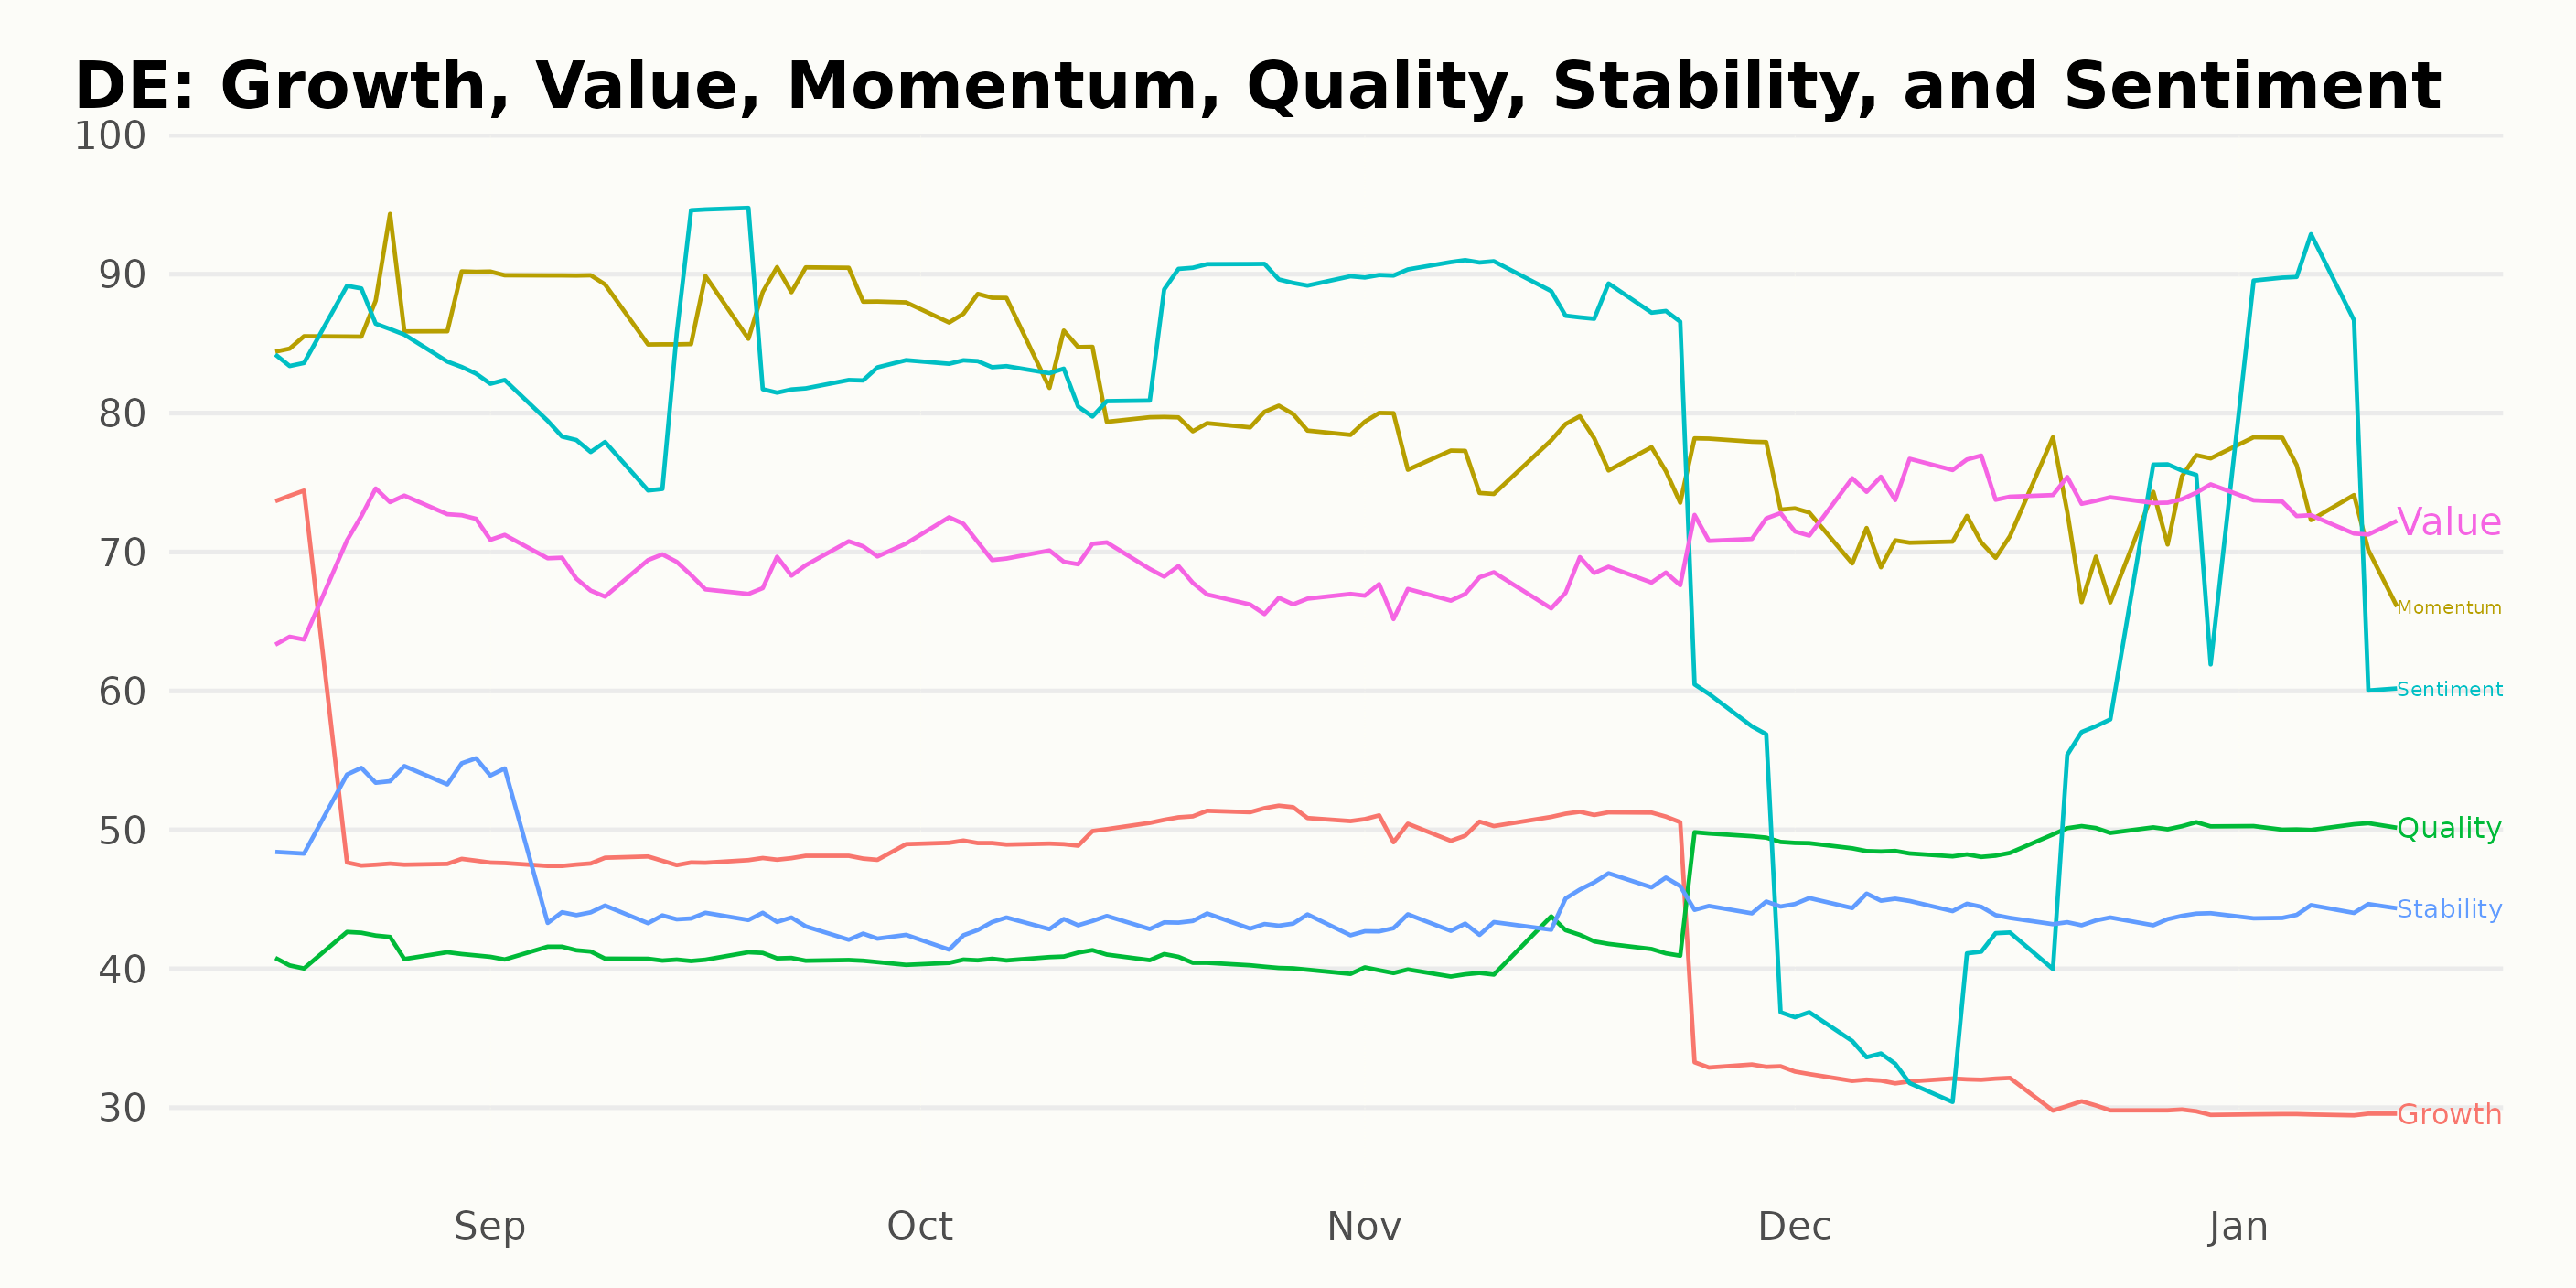
Analyzing Deere & Company's Performance: Momentum, Value, and Sentiment Ratings
DE has an overall C rating, translating to a Neutral in our POWR Ratings system. It is ranked #54 out of the 80 stocks in the Industrial - Machinery category.
Based on the POWR Ratings for Deere & Company (DE), the three most noteworthy dimensions include Momentum, Value, and Sentiment. Here's a discussion of each.
- Momentum: Throughout the time period, Momentum stands out with consistently high ratings. Notably, in August 2023, it secured an impressive value of 87, making it the highest rating at that time. This strong rating indicates a particularly robust upward trend. However, over time, there has been a slow decrease, with Momentum dropping to 74 by January 2024.
- Value: The Value dimension has also been consistently high for DE. It reached a peak rating of 74 in December 2023. Although the values somewhat fluctuate over the period, they remain generally consistent in the high range, indicating DE's persistent value.
- Sentiment: The Sentiment rating has fluctuated slightly during the period under scrutiny. In August and October 2023, it reached high values of 85 and 86, respectively. It later dipped to a lower value of 49 in December 2023 but bounced back up to a strong 81 by January 2024, suggesting a recovering positive sentiment towards DE.
How does Deere & Company (DE) Stack Up Against its Peers?
Other stocks in the Industrial – Machinery sector that may be worth considering are Tennant Company (TNC), Twin Disc, Incorporated (TWIN) and Caterpillar, Inc. (CAT) -- they have better POWR Ratings.
What To Do Next?
Get your hands on this special report with 3 low priced companies with tremendous upside potential even in today’s volatile markets:
3 Stocks to DOUBLE This Year >
DE shares were trading at $377.18 per share on Tuesday afternoon, down $12.21 (-3.14%). Year-to-date, DE has declined -5.67%, versus a 3.51% rise in the benchmark S&P 500 index during the same period.
About the Author: Subhasree Kar

Subhasree’s keen interest in financial instruments led her to pursue a career as an investment analyst. After earning a Master’s degree in Economics, she gained knowledge of equity research and portfolio management at Finlatics.
The post Deere & Co. (DE) Earnings Spotlight: Buy or Hold? appeared first on StockNews.com