
Consumer finance companies like American Express Company (AXP) have faced challenges due to the Federal Reserve’s aggressive rate hiking campaign. Conversely, in the last reported quarter, AXP reported record revenue and earnings per share, boosted by the company’s growing millennial and Gen Z customer base.
However, the company also kept its full-year 2023 guidance for revenue growth of 15% to 17% and EPS of $11.00 to $11.40, which could indicate a potential slowdown. Moreover, rising borrowing costs led AXP to substantially increase its provisions for credit losses to $1.2 billion from $410 million a year ago.
AXP also unveiled several upgrades to its American Express® Business Gold Card, adding annual statement credits worth up to $395, new 4X bonus spending categories, and cell phone insurance. On the other hand, the company also plans to increase the card’s annual fee from $295 to $375 and eliminate some existing benefits. This could impact cardholders’ spending propensity.
In view of these conditions, it would be prudent to scrutinize AXP's principal financial indicators to comprehend why deferring investment until a more advantageous situation arises ahead of the third-quarter earnings announcement on October 20 could be a strategic move.
Analyzing American Express Company's Financial Performance
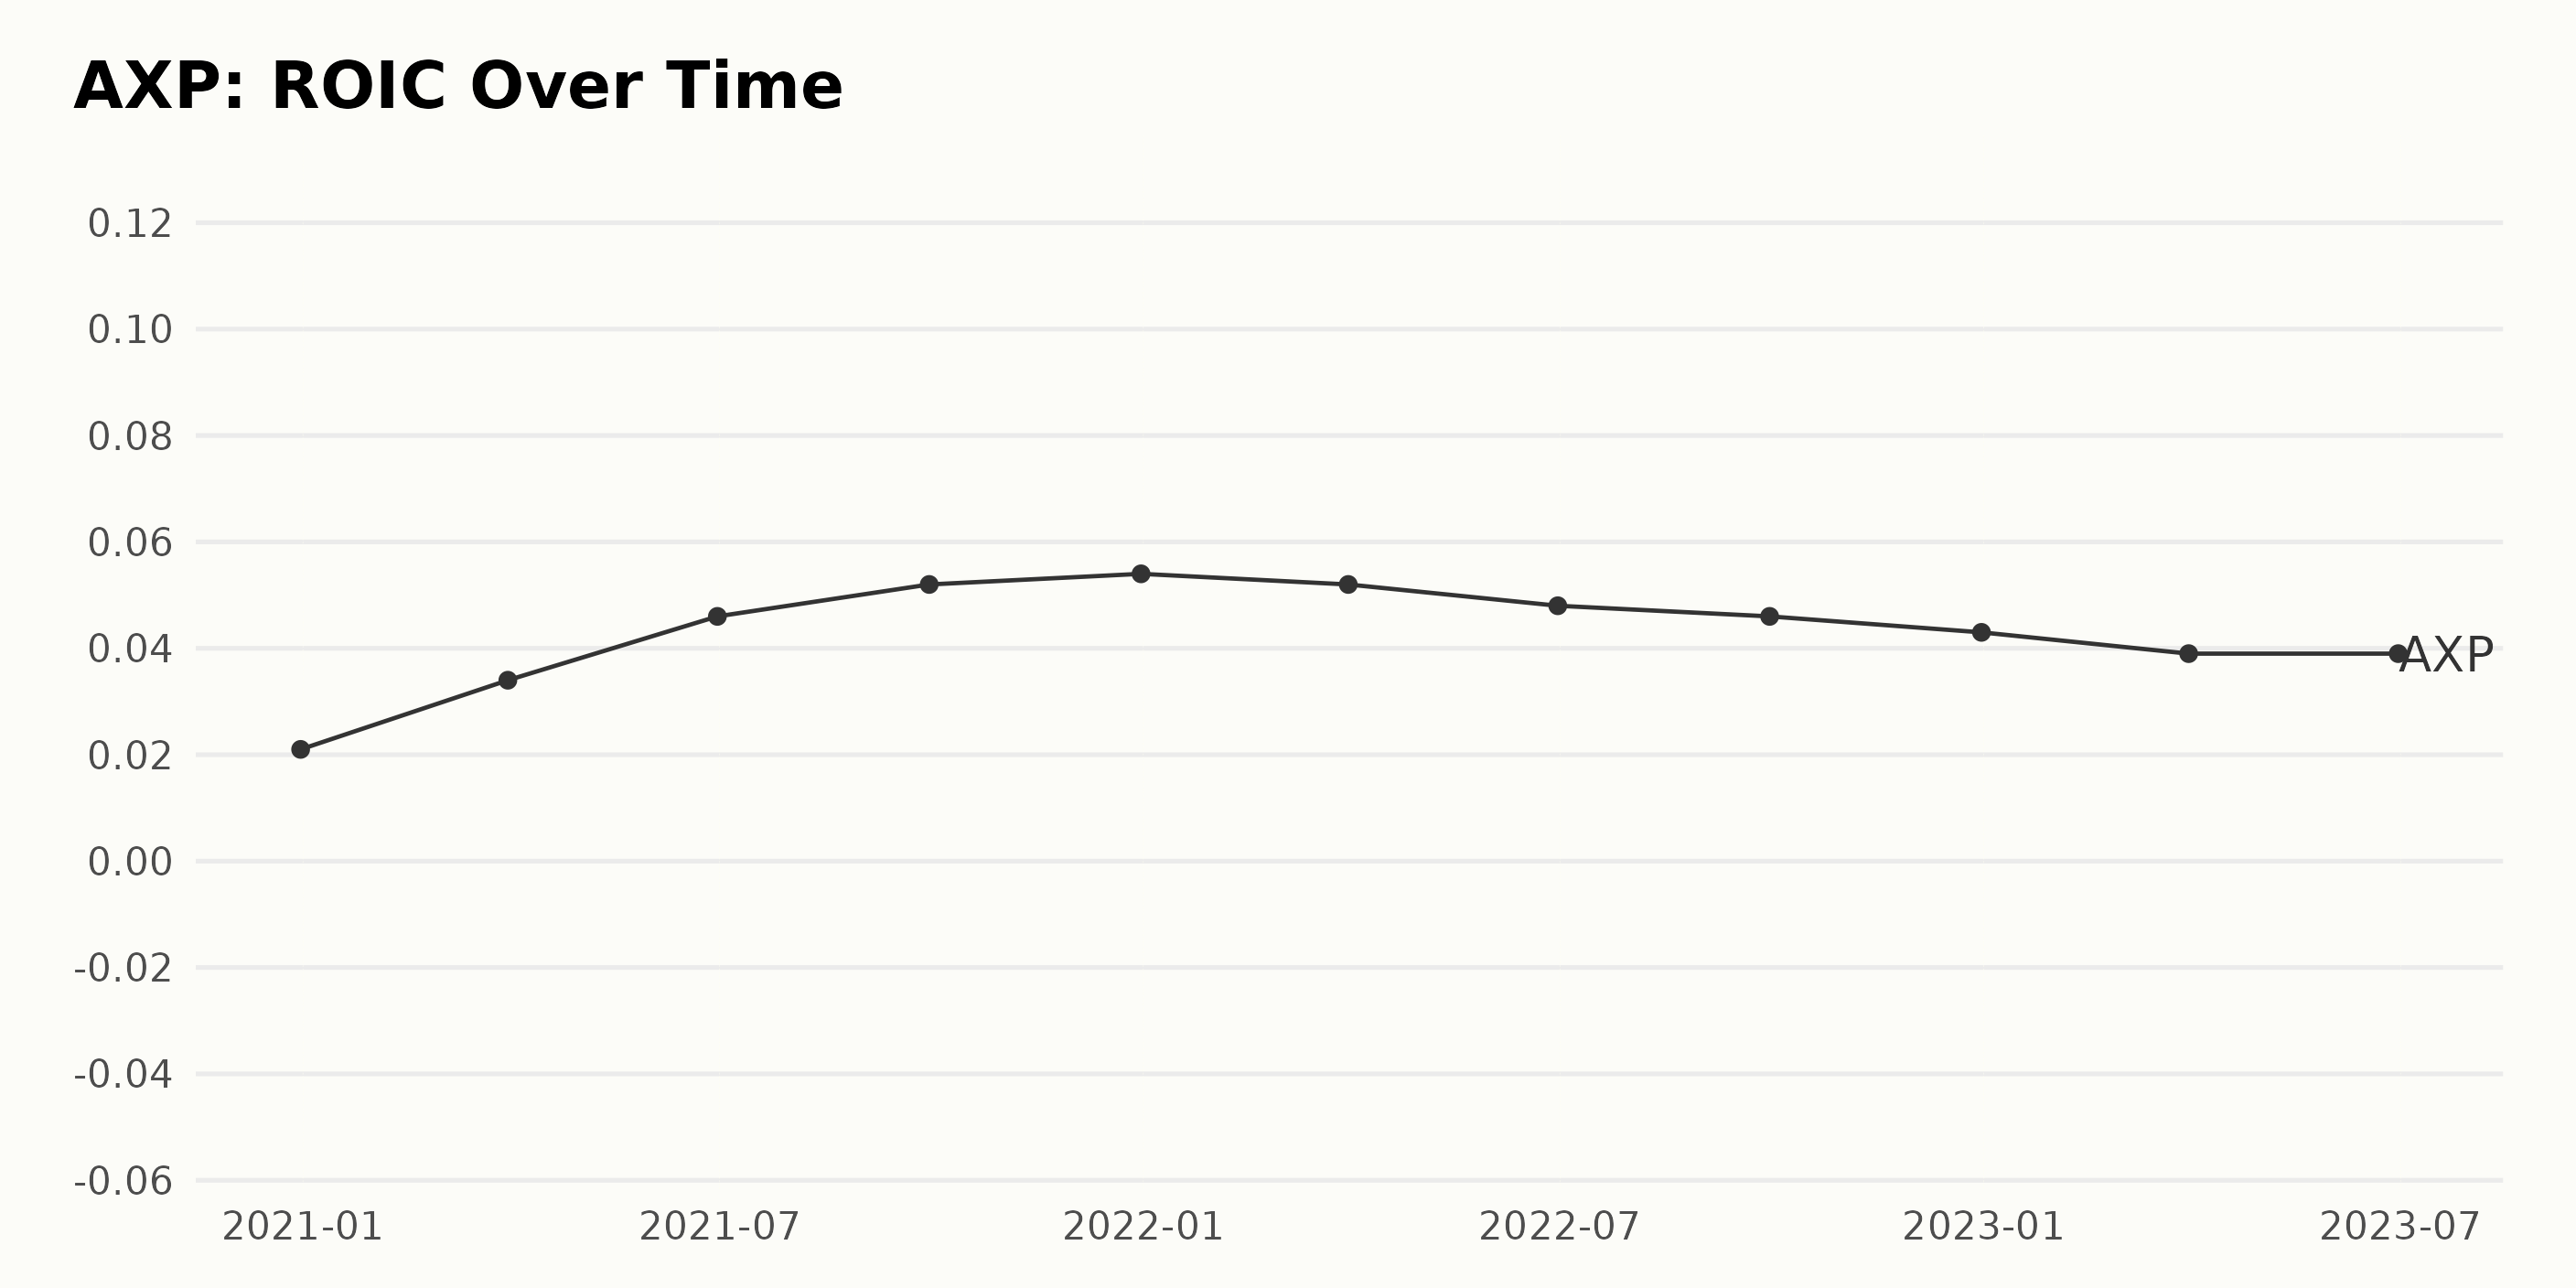
The Return On Invested Capital (ROIC) trend of AXP shows a noticeable fluctuation over the years 2020 to 2023. Here are the key highlights:
- Starting at 0.021 (2.1%) on December 31, 2020, there was a consistent upward trend until the end of 2021. By December 31, 2021, the ROIC value reached its peak at 0.054 (5.4%). This represents an increase of approximately 157% within one year.
- From the first quarter of 2022, however, AXP's ROIC started to decline. This downward trend continued through 2022, falling from 0.052 (5.2%) in March to 0.043 (4.3%) by the end of the year.
- In the first half of 2023, the ROIC seemed to stabilize somewhat, remaining at 0.039 (3.9%).
These data points suggest that while AXP experienced a strong growth phase in its ROIC through 2021, it has faced challenges since the start of 2022, leading to decreasing numbers.
The stabilization in the first half of 2023 may indicate a plateau in this downward trend. Overall, between the initial measure in December 2020 and the last recorded data point in June 2023, the ROIC saw an approximate overall growth of 86%.
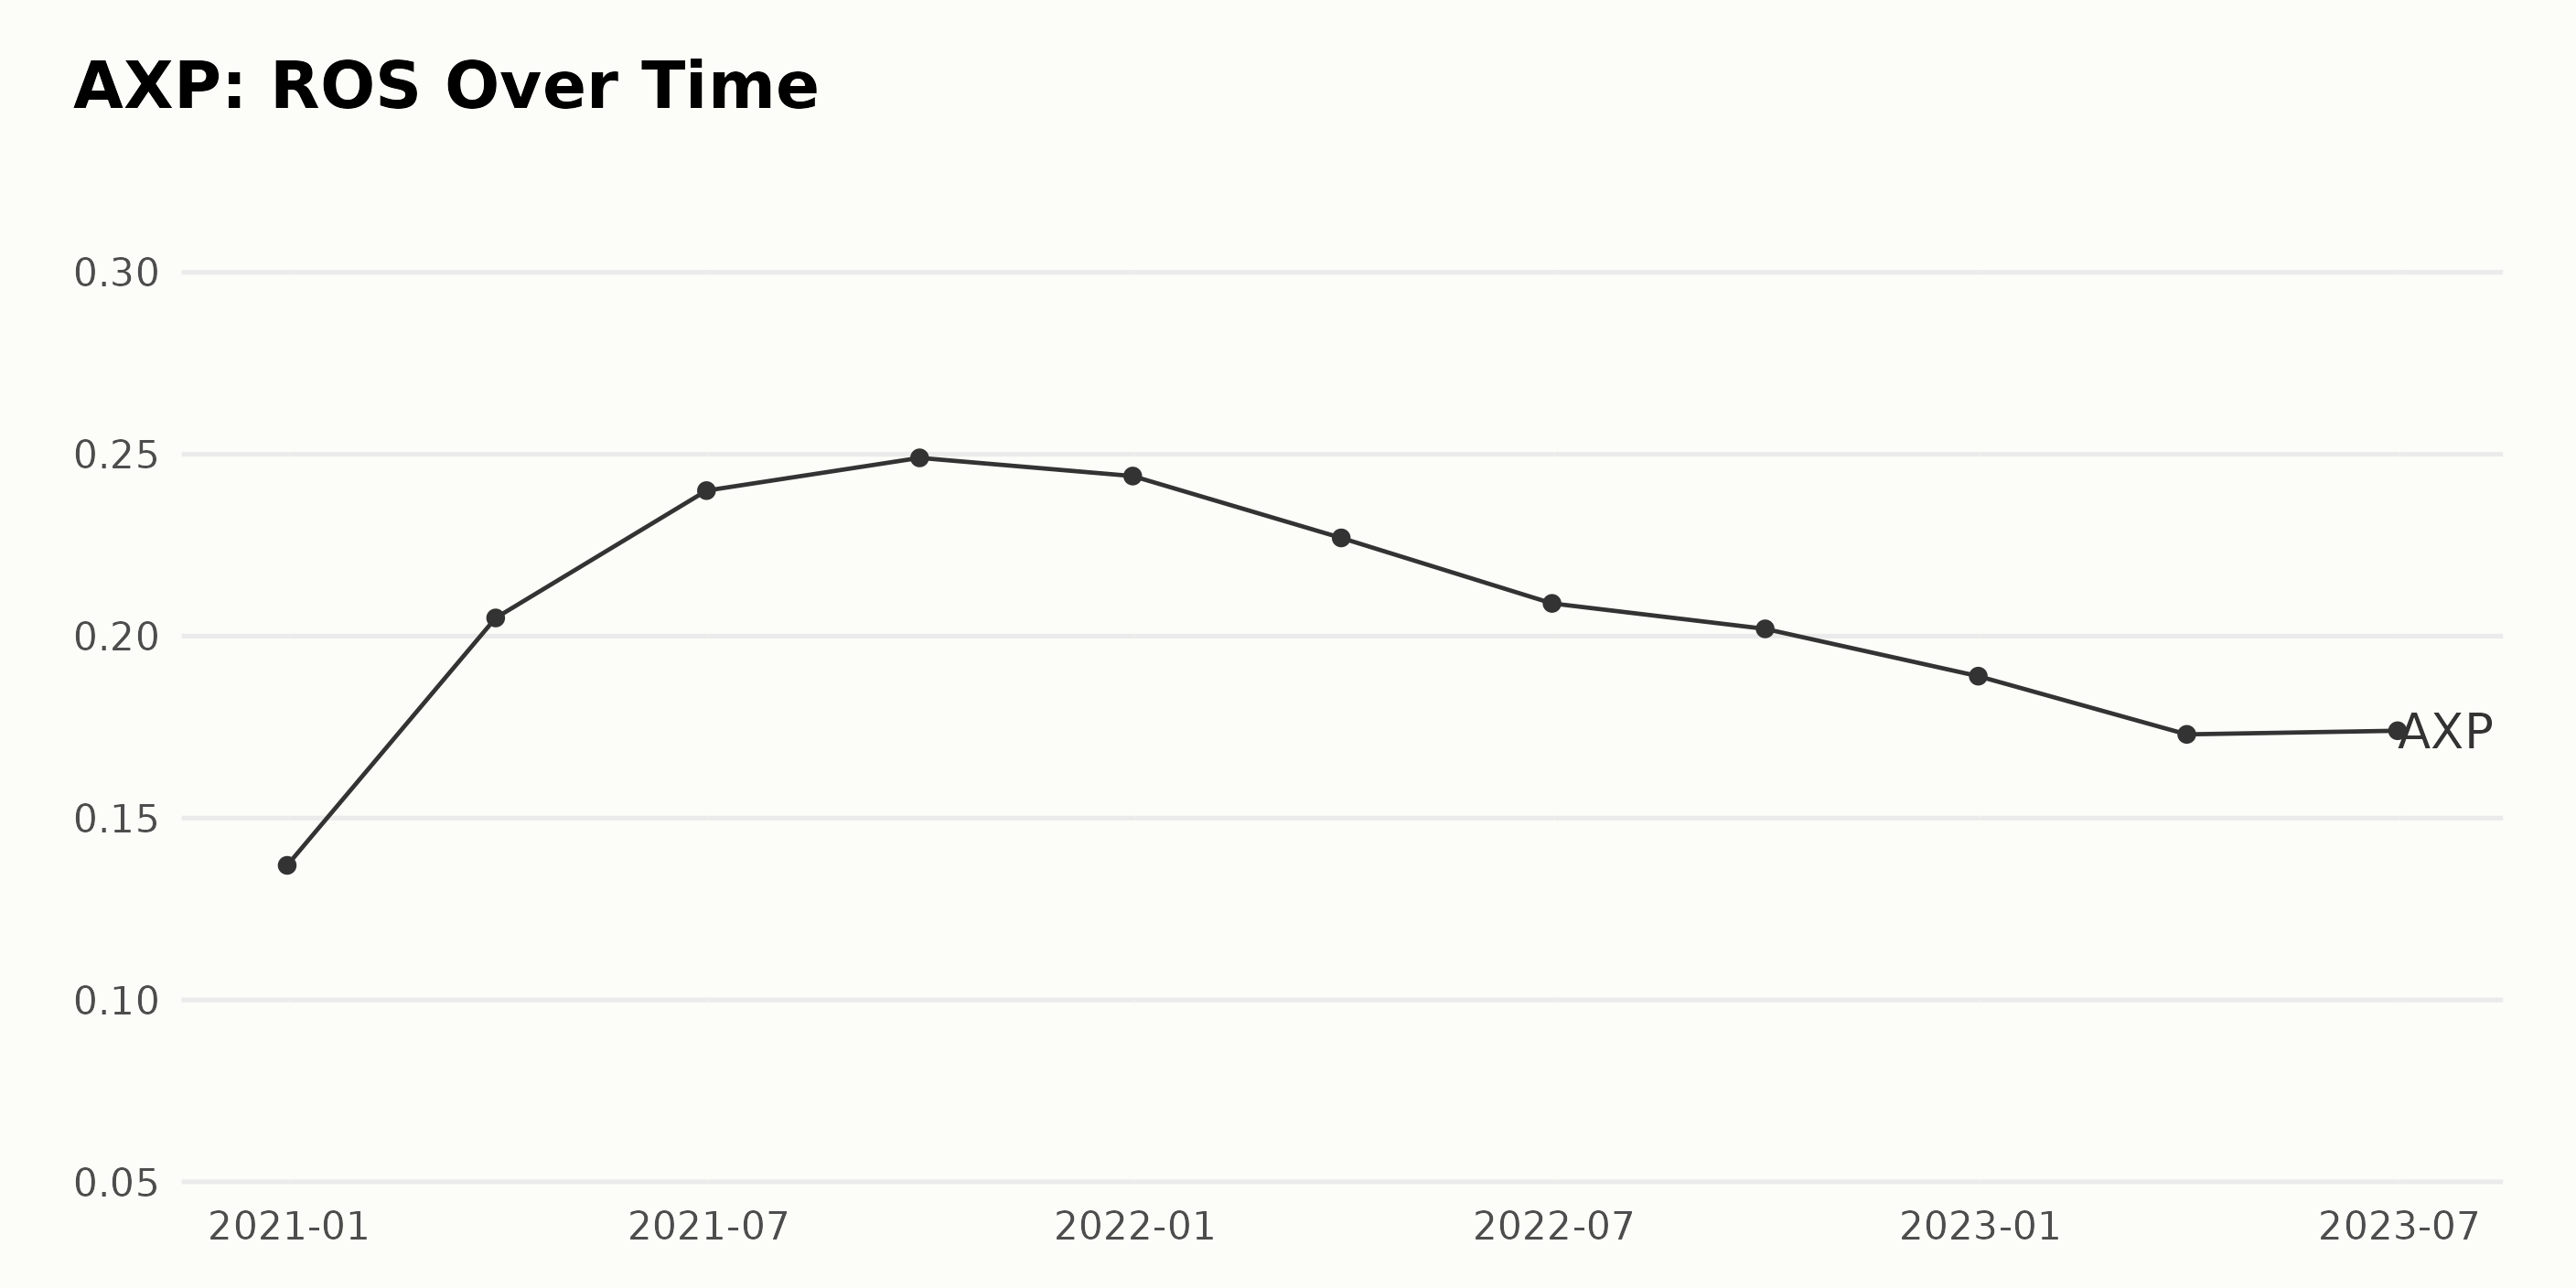
The trend and fluctuations in the Return On Sales (ROS) of AXP are as follows:
- As of December 31, 2020, the ROS stood at 0.14.
- The ROS saw significant growth, peaking at 0.25 by September 30, 2021. This represents a growth rate of approximately 79% from the initial value in December 2020.
- Subsequently, there was a slight dip to 0.24 by December 31, 2021, but the value remained relatively high compared to the start of the year.
- In 2022, the ROS started to decline steadily. It went down to 0.23 in March, further dropping to 0.21 by June, and reached 0.20 in September. By December 31, 2022, the ROS stood at 0.19, a decrease of approximately 21% compared to its peak in September 2021.
- Heading into 2023, the decline continued, with the ROS measuring 0.17 in March 2023.
- However, this falling trend appeared to stabilize as of June 30, 2023, when the ROS maintained at 0.17, ending the period of study without any further decline.
Overall, there is a clear upward trend in the first three quarters of 2021, followed by a steady decline into 2022 and early 2023. But the most recent data suggests this decline may have plateaued, and the ROS appears to be stabilizing as of mid-2023.
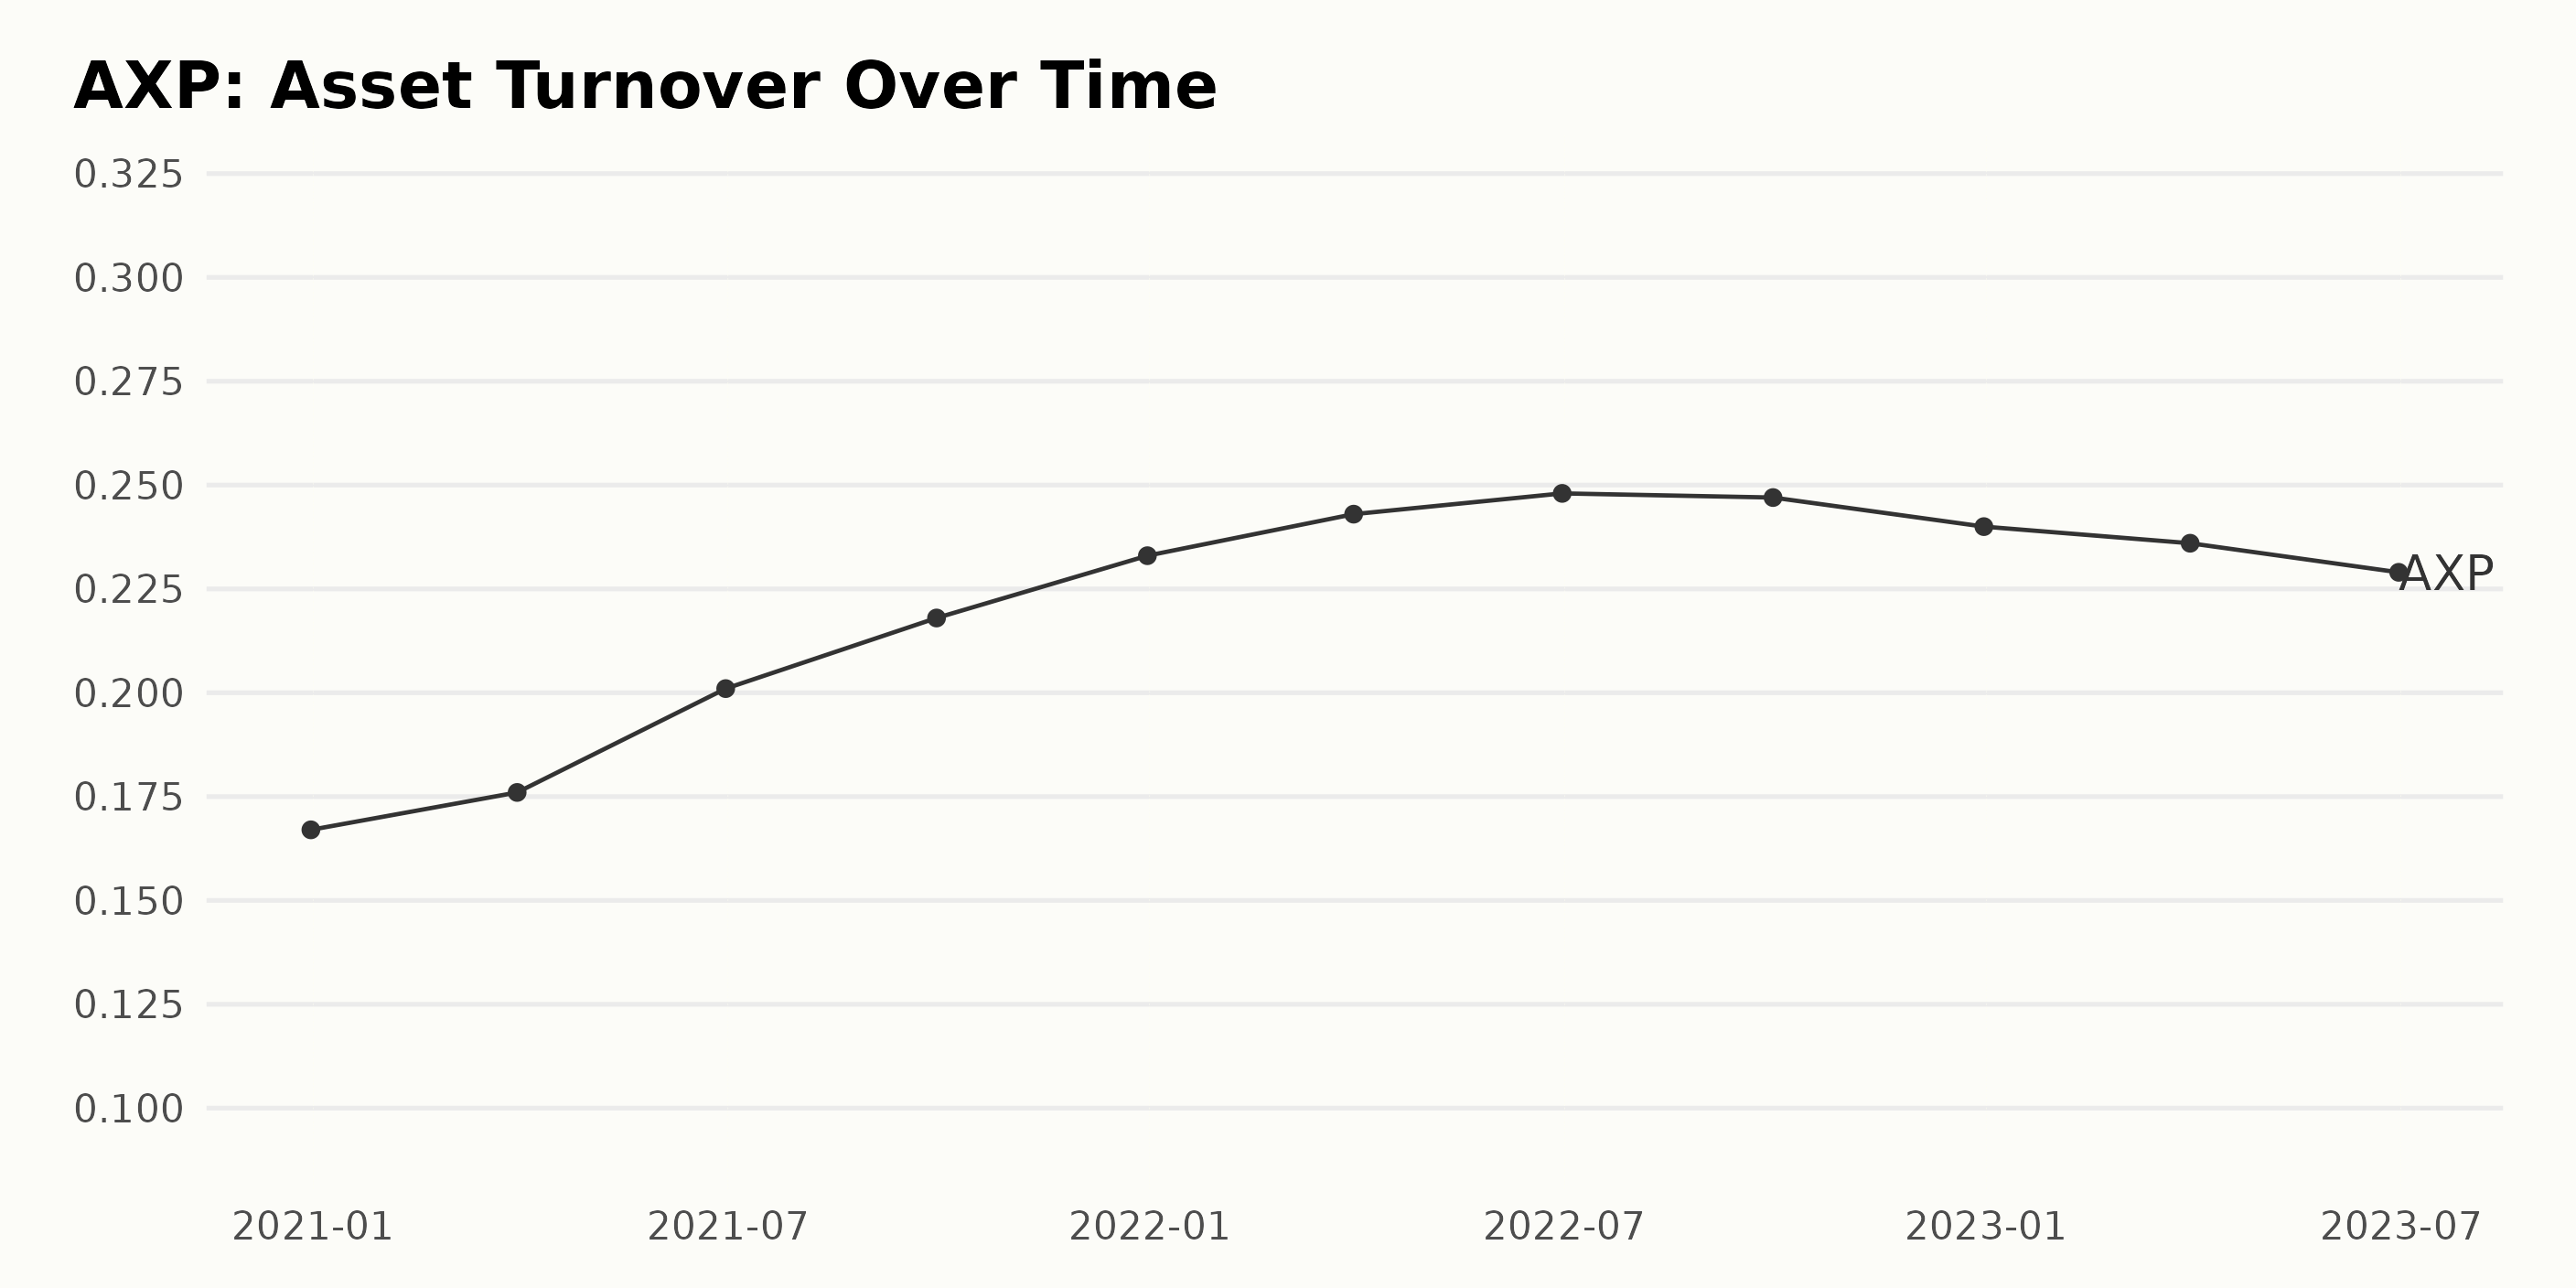
The data presents the asset turnover for AXP over a period of about three years, from December 2020 to June 2023.
- Starting at 0.167 in December 2020, the asset turnover demonstrated an upward trend throughout 2021 and mid-2022.
- An increase was observed from 0.167 in December 2020 to 0.176 in March 2021, followed by a further rise to 0.201 in June 2021.
- By the end of 2021, the asset turnover climbed to 0.233, representing a significant improvement from the start of the year.
- The growth trend continued into the first half of 2022, reaching a high of 0.248 in June 2022.
However, from the third quarter of 2022 onwards, there is a noticeable decline in the asset turnover.
- It slightly dipped to 0.247 in September 2022 before declining more notably to 0.24 in December 2022.
- By March 2023, the asset turnover approached 0.236 and further dropped to 0.229 by June 2023.
This indicates that although there was a steady increase in asset turnover in the initial part of the series, this was followed by a downturn trend after mid-2022. In terms of growth rate, measured from the first value to the last, the asset turnover of AXP increased by a net of 0.062 or 37% over the approximated three-year period. Despite recent fluctuations, this signifies overall positive growth.
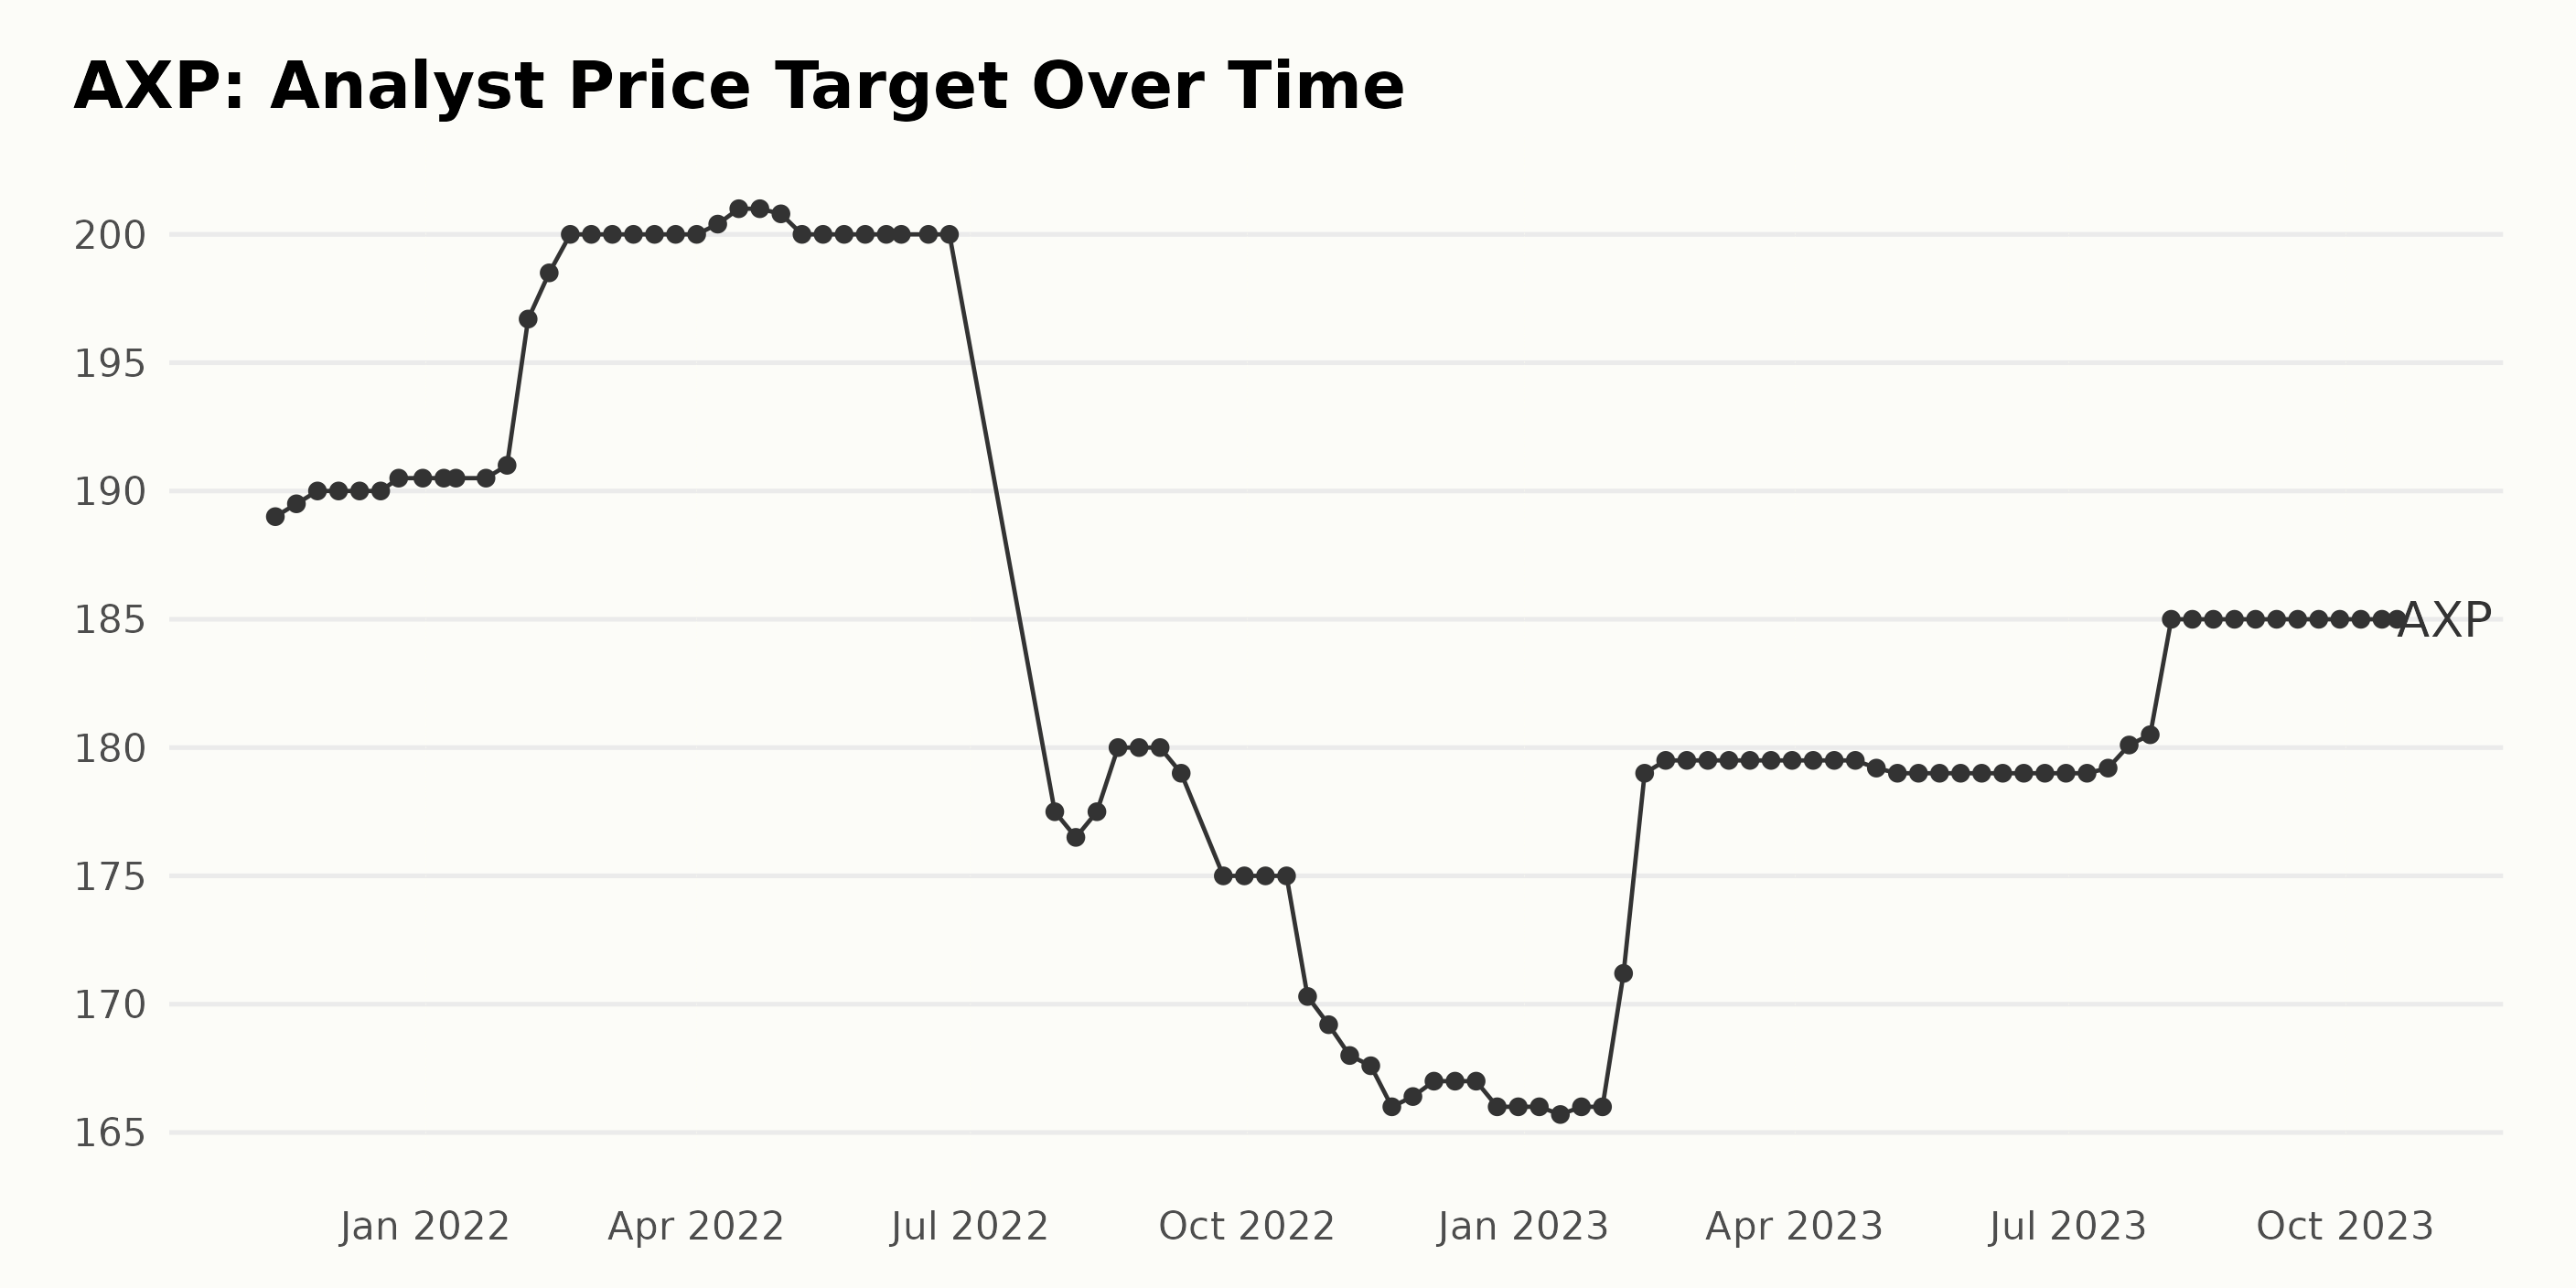
The analyst price target of AXP has demonstrated significant fluctuations over the observed period. Here's a breakdown of the major highlights:
- Starting at $189 on November 12, 2021, the analyst price target initially showed a slow but steady increase, asserting itself at $200 by February 18, 2022.
- The upward trend remained relatively unaltered until May 6, 2022, after which it registered a sharp decline to $177.5 by July 29, 2022.
- This decline was followed by another period of instability, with fluctuation evident from the end of July 2022 to the start of November 2022, where the price target dropped as low as $165.7 by January 13, 2023.
- However, since February 3, 2023, the analyst price target indicates renewed confidence, rising gradually from $171.2 to culminate at a value of $185 as of October 18, 2023.
Overall, the analyst price target for AXP has seen a decrease of roughly -2.11% when comparing the first recorded value to the last one. These fluctuations indicate varying levels of analyst sentiment and changes in the projected financial performance of AXP.
American Express Share Performance: A Roller-coaster Ride from April to October 2023
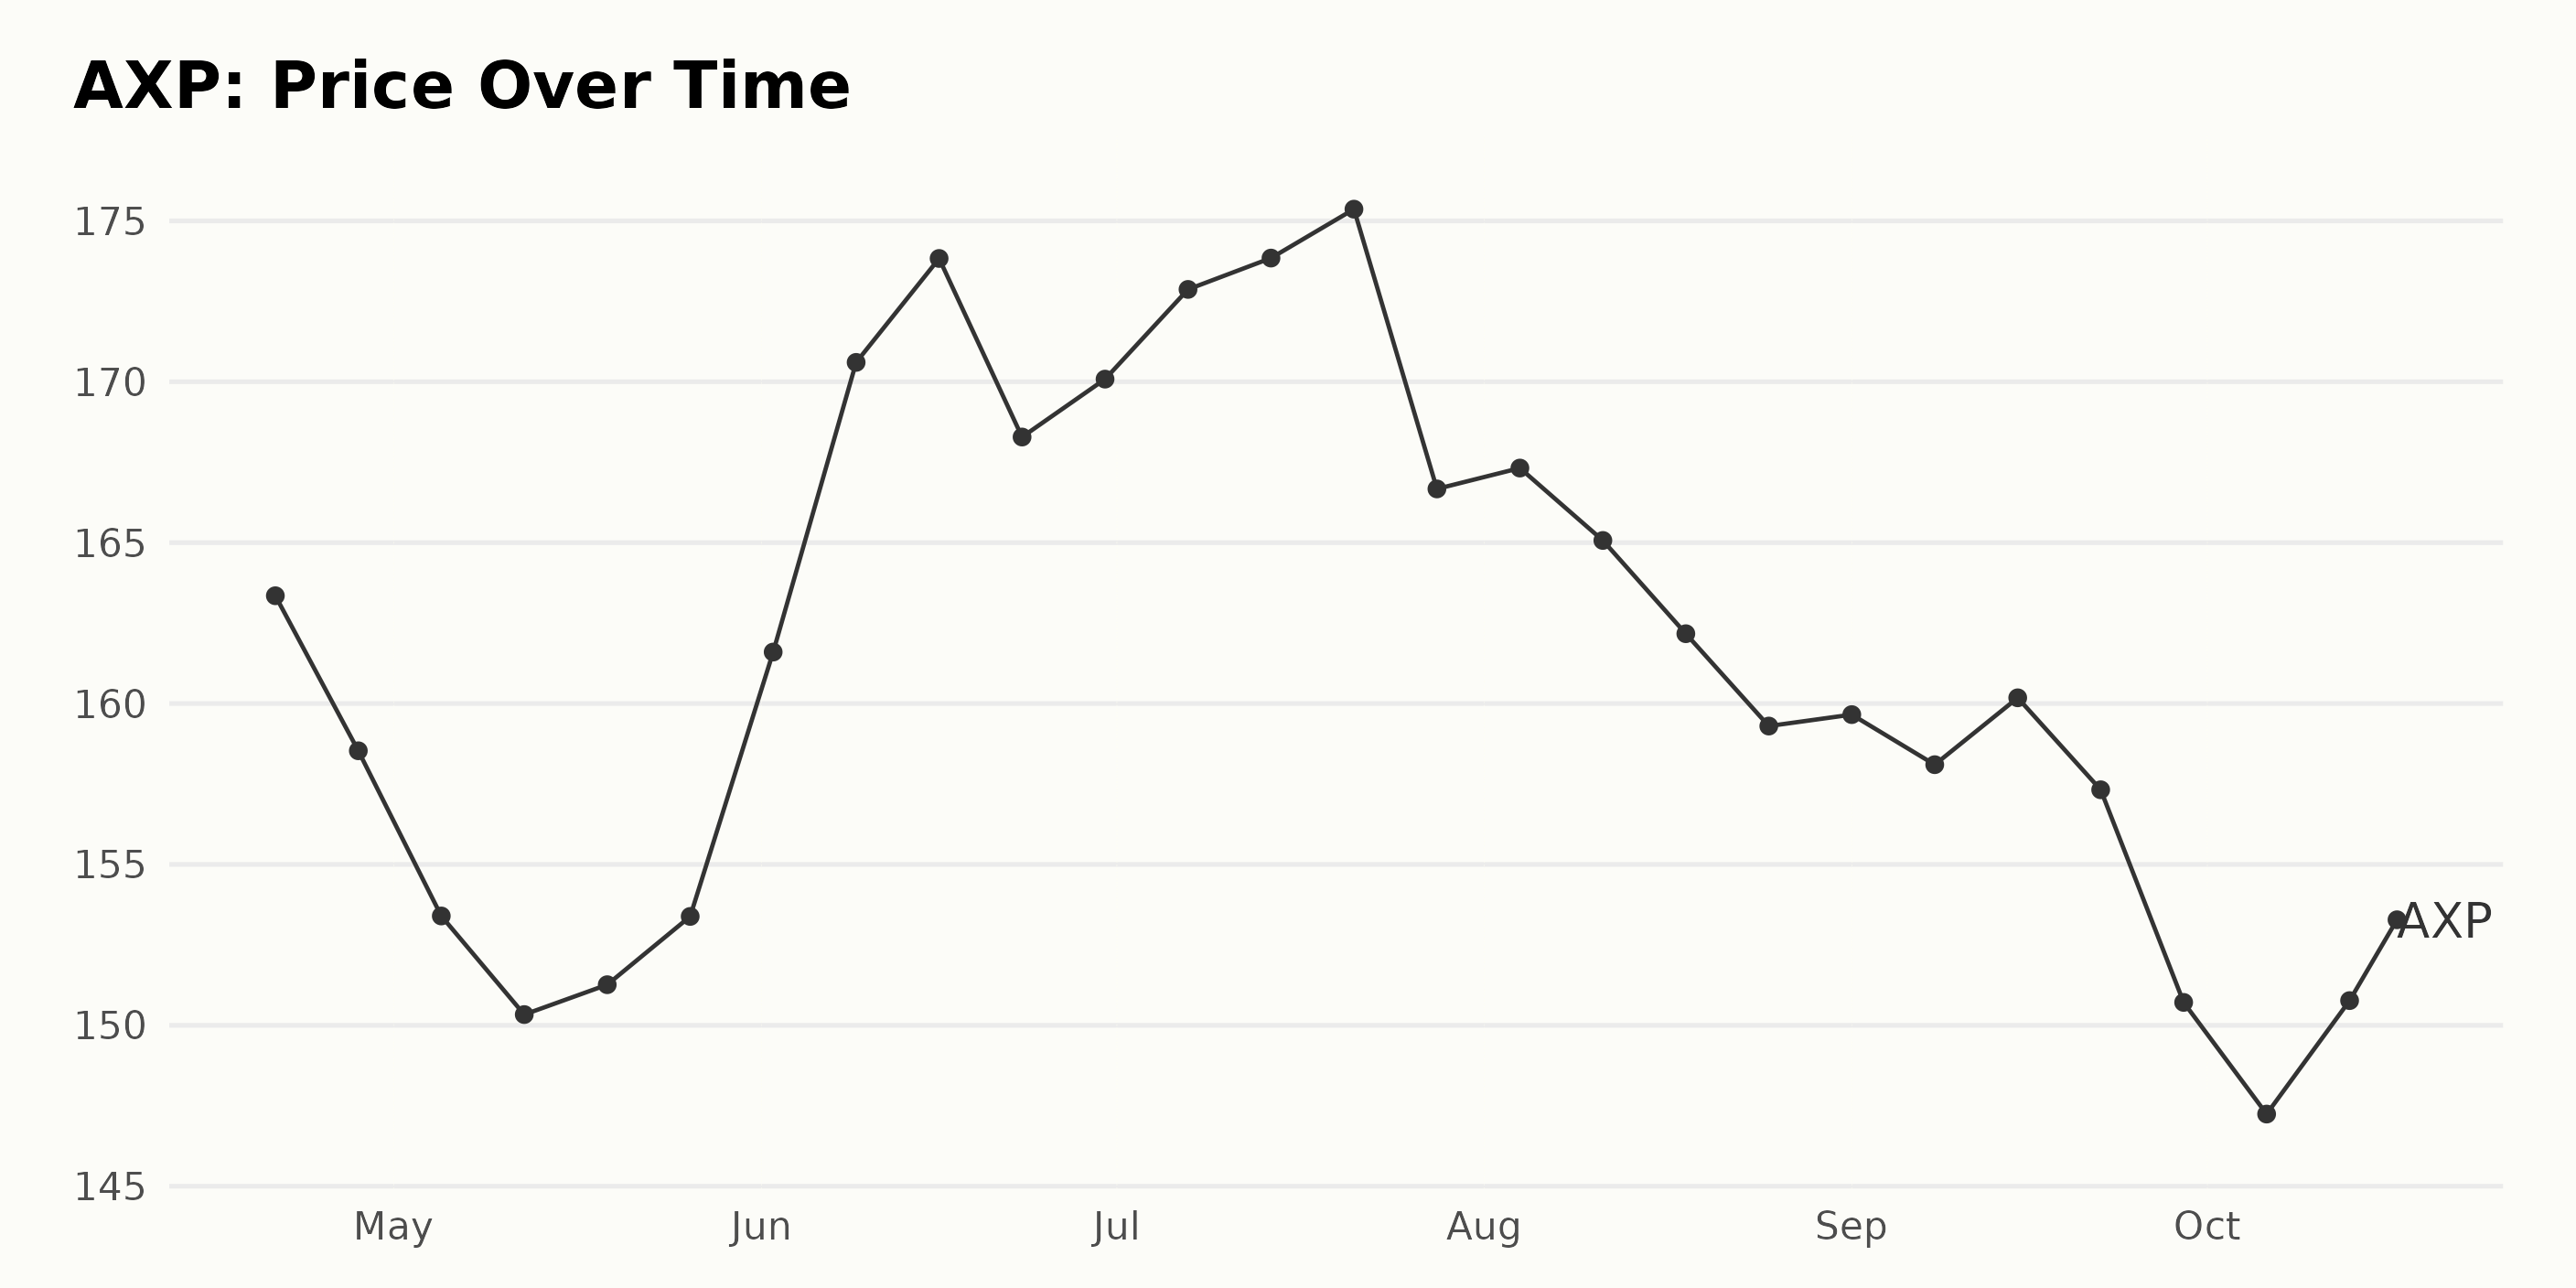
Based on the data provided, here is the trend and growth rate of AXP share prices from April 21, 2023, to October 17, 2023:
- On April 21, 2023, the share price was $163.35.
- The price experienced a downward trend until May 12, 2023, when it reached a low of $150.33.
- From May 19, 2023, to June 23, 2023, there was an ascending trend. Prices surged to $170.60 on June 9 and peaked at $173.83 on June 16. On June 23, there was a slight dip to $168.28.
- In July 2023, the price kept a steady but increasing inclination, reaching $175.36 by July 21.
- Starting the last week of July, the share price began a consistent decline, hitting $166.67 by July 28. The declining trend continued through August and early September, reaching a low of $158.1 on September 8.
- Despite slight fluctuations, the declining trend persisted into late September and early October. By October 6, the price went down to $147.24.
- As of the latest data point, on October 17, 2023, the share price had risen to $154.39.
In summary, AXP share prices experienced several fluctuations between April 21, 2023, and October 17, 2023. After initially dropping in April and early May, prices rebounded and reached their peak in mid-June. After that, however, there has been a general downward trend, with a brief period of stability in July before prices resumed their decline. Here is a chart of AXP's price over the past 180 days.
Analyzing American Express: Quality, Stability, and Momentum Through 2023
The POWR Ratings Grade of AXP, which is in the Consumer Financial Services category of stocks, shows a certain variation over the range of data provided.
- The POWR Grade started at a C (Neutral) in April 2023, suggesting it was an average performer relative to its peer group.
- It maintained the same grade from April until July, with variations in rank within the category from #15 to #22 during this period.
- In August 2023, the POWR Grade improved to a B (Buy), indicating improved performance. This superior grade was retained through September, with the rank fluctuating between #12 and #16 in the category.
- However, from the end of September until mid-October, the POWR Grade dropped back to C (Neutral), with the ranking also slightly worsening as per the given data.
As of the latest data point on October 18, 2023, AXP holds a POWR Grade of C (Neutral) with a rank in the category of #16 out of 48 stocks. This portrays an average level of performance within the Consumer Financial Services category.
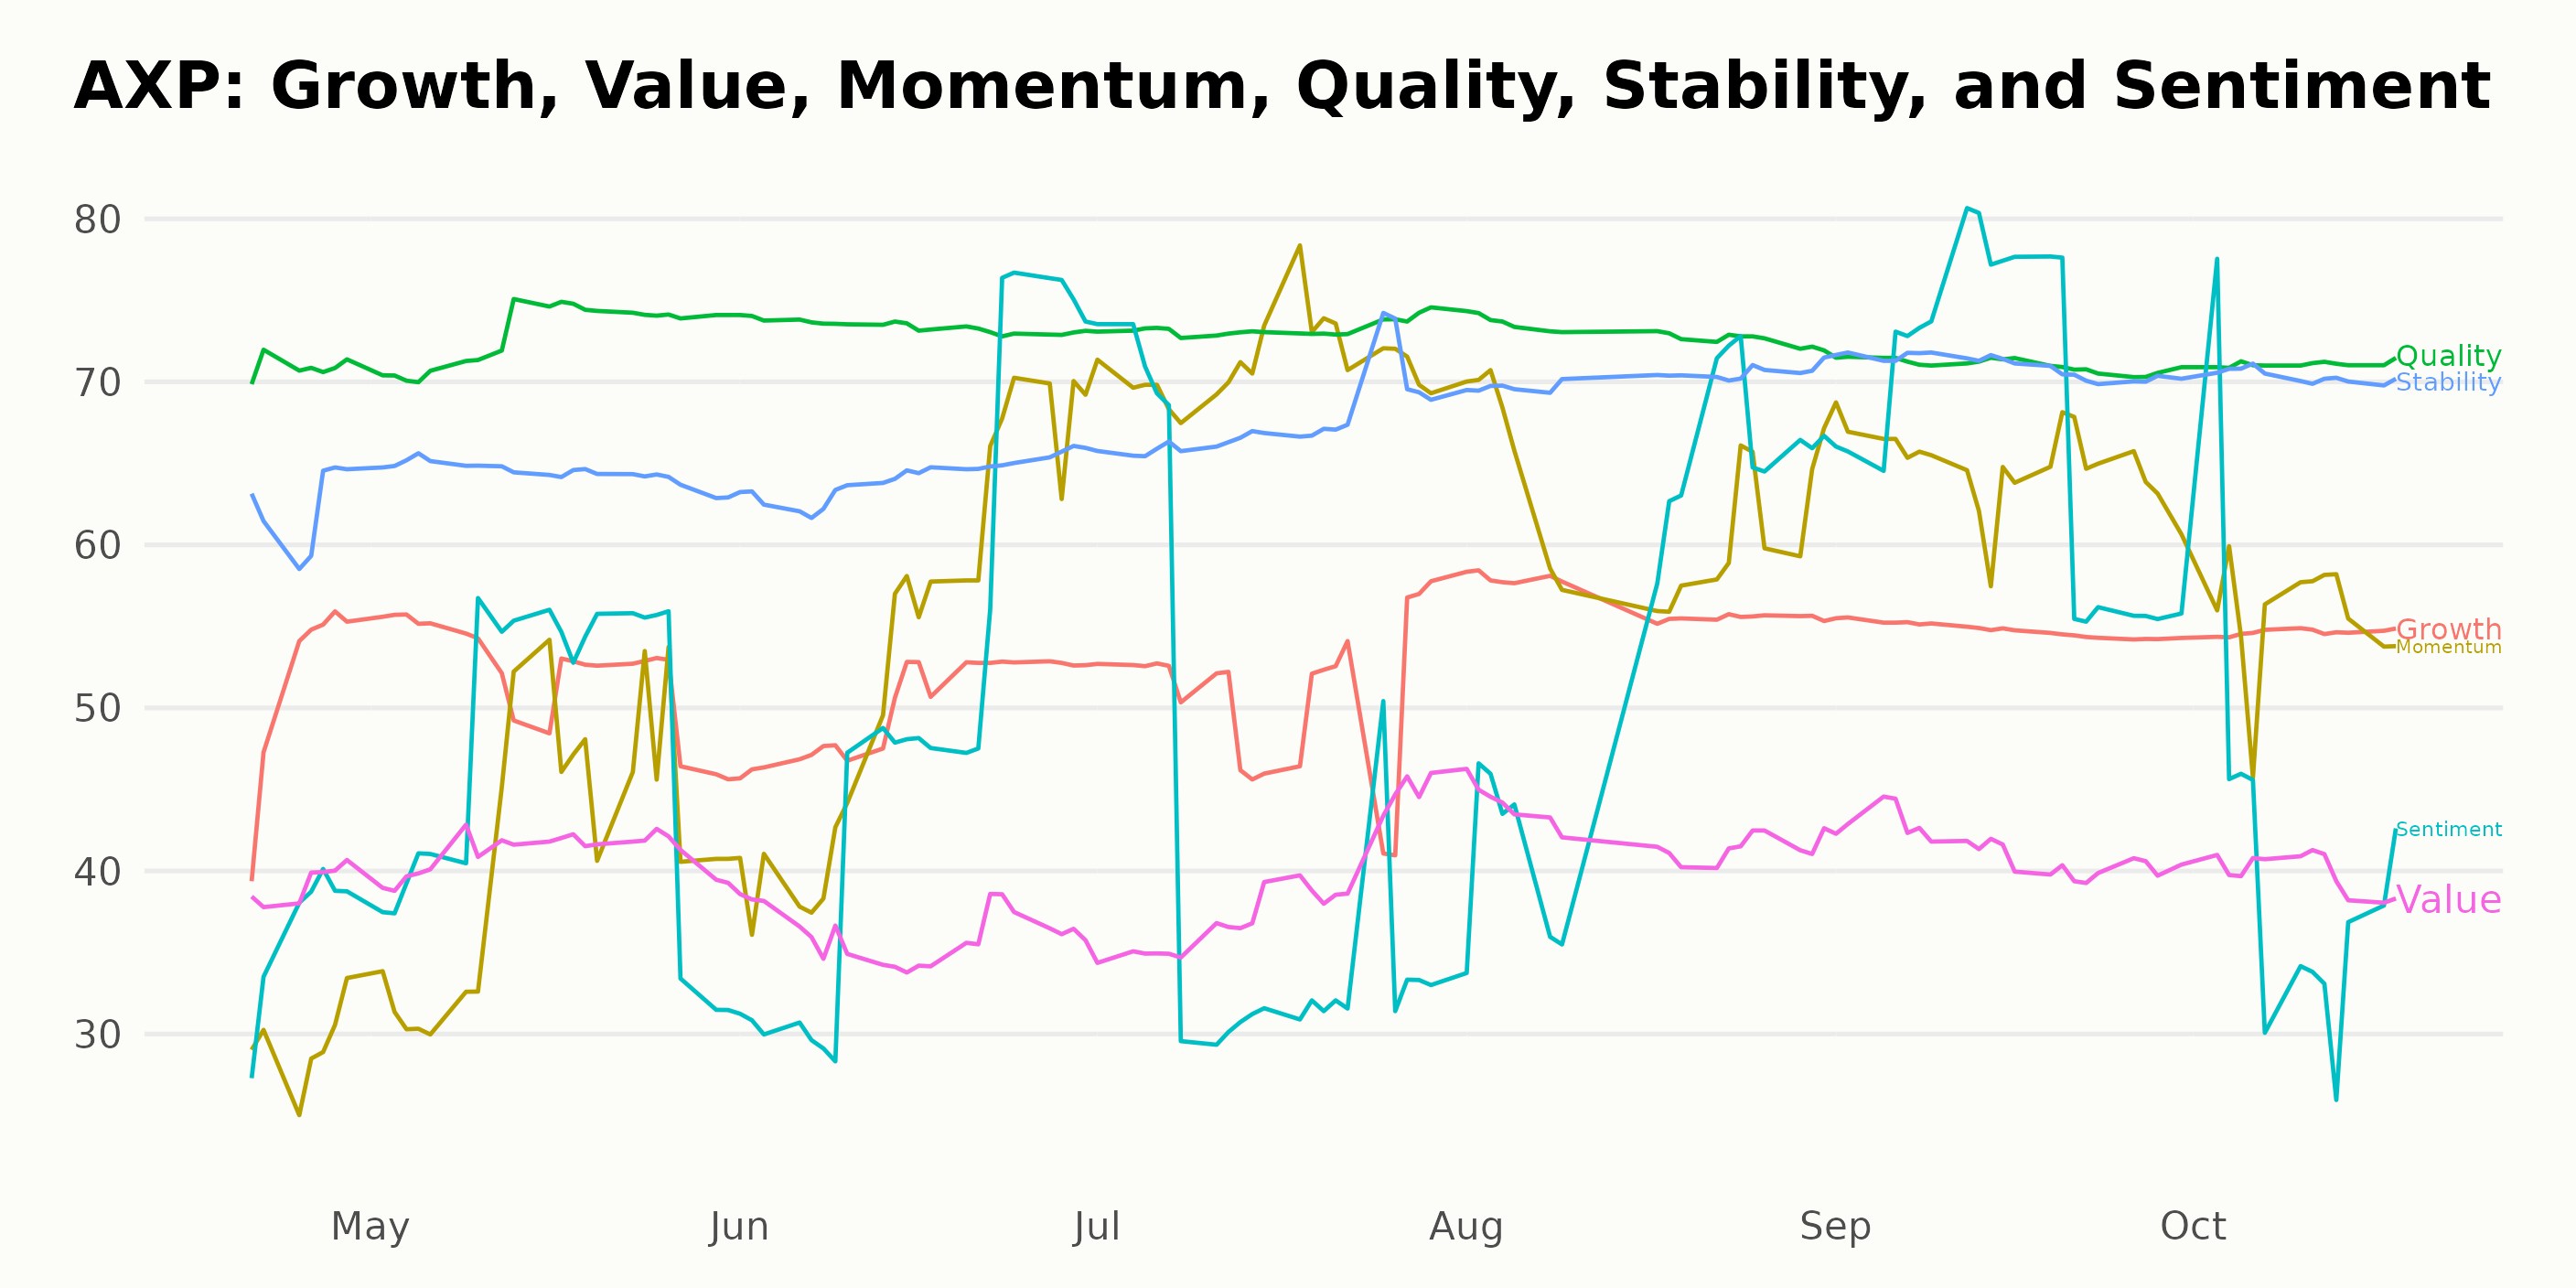
Based on the POWR Ratings data provided, the three most noteworthy dimensions for AXP are Quality, Stability, and Momentum.
Quality: Quality consistently holds the highest rating among all dimensions over time. Having predominantly a value of 73, it demonstrates that AXP is perceived to have sound business operations.
- April 2023: 71
- May 2023: 73
- June 2023: 73
- July 2023: 73
- August 2023: 73
- September 2023: 71
- October 2023: 71
Stability: The Stability dimension has shown a general trend of growth from 62 to 70 from April to October 2023, suggesting an increasing level of stability in the company.
- April 2023: 62
- May 2023: 64
- June 2023: 64
- July 2023: 68
- August 2023: 70
- September 2023: 71
- October 2023: 70
Momentum: The Momentum dimension shows a clear upward trend from April 2023 (29) to September 2023 (65) before slightly dropping in October 2023 (56). This unveils growing momentum in the performance of AXP within this period, implying increased interest among investors.
- April 2023: 29
- May 2023: 42
- June 2023: 54
- July 2023: 71
- August 2023: 63
- September 2023: 65
- October 2023: 56
How does American Express Company (AXP) Stack Up Against its Peers?
Other stocks in the Consumer Financial Services sector that may be worth considering are EZCORP, Inc. (EZPW), World Acceptance Corporation (WRLD), and Regional Management Corp. (RM) - they have better POWR Ratings. Click here to explore more Consumer Financial Services sector stocks.
What To Do Next?
Discover 10 widely held stocks that our proprietary model shows have tremendous downside potential. Please make sure none of these “death trap” stocks are lurking in your portfolio:
AXP shares were trading at $151.65 per share on Wednesday afternoon, down $2.74 (-1.77%). Year-to-date, AXP has gained 4.16%, versus a 14.10% rise in the benchmark S&P 500 index during the same period.
About the Author: Anushka Dutta

Anushka is an analyst whose interest in understanding the impact of broader economic changes on financial markets motivated her to pursue a career in investment research.
The post American Express (AXP) Earnings Preview: Is the Consumer Financial Stock on a Path to Recovery? appeared first on StockNews.com