
Prominent telecommunication company AT&T (T) exceeded the consensus EPS projections in the second quarter; however, it fell short of the revenue estimates.
Higher investments in 5G infrastructure propel the telecom industry due to customer preference for advanced tech and smartphones. Additionally, more mobile subscribers, high-speed data demand, and interest in value-added services contribute to market growth.
The global telecom services market is projected to grow at a 6.2% CAGR until 2030.
However, the industry recently experienced some challenges. Contributing to this tumble was a report unearthing that major network providers had left lead-coated cables from the obsolete Bell System scattered across various locations throughout the United States. This revelation triggered a spate of downgrades from analysts, resulting in a sharp plummet in telecom stocks.
T sunk to its lowest since 1993 last month. In response to looming long-term liability concerns, JPMorgan Chase & Co (JPM) analysts joined the rank of other analysts and downgraded the stock.
In addition, on August 1, T paid a quarterly dividend of $0.2775 per share on the company's common share. The company pays an annual dividend of $1.11, which translates to a 7.78% yield on the current price level. The company has a four-year average dividend yield of 7%. However, its dividend payout has fallen at a CAGR of 10.8% over the past three years.
Furthermore, mounting inflation, escalating interest rates, and economic uncertainty could undeniably shadow the telecommunications sector.
Therefore, it appears improbable that T will regain 'buy' status this month. Let's look at the trends of T’s financial metrics to understand the situation.
T’s Financial Performance: Analyzing Net Income, ROIC, Current Ratio, and Analyst Price Target:
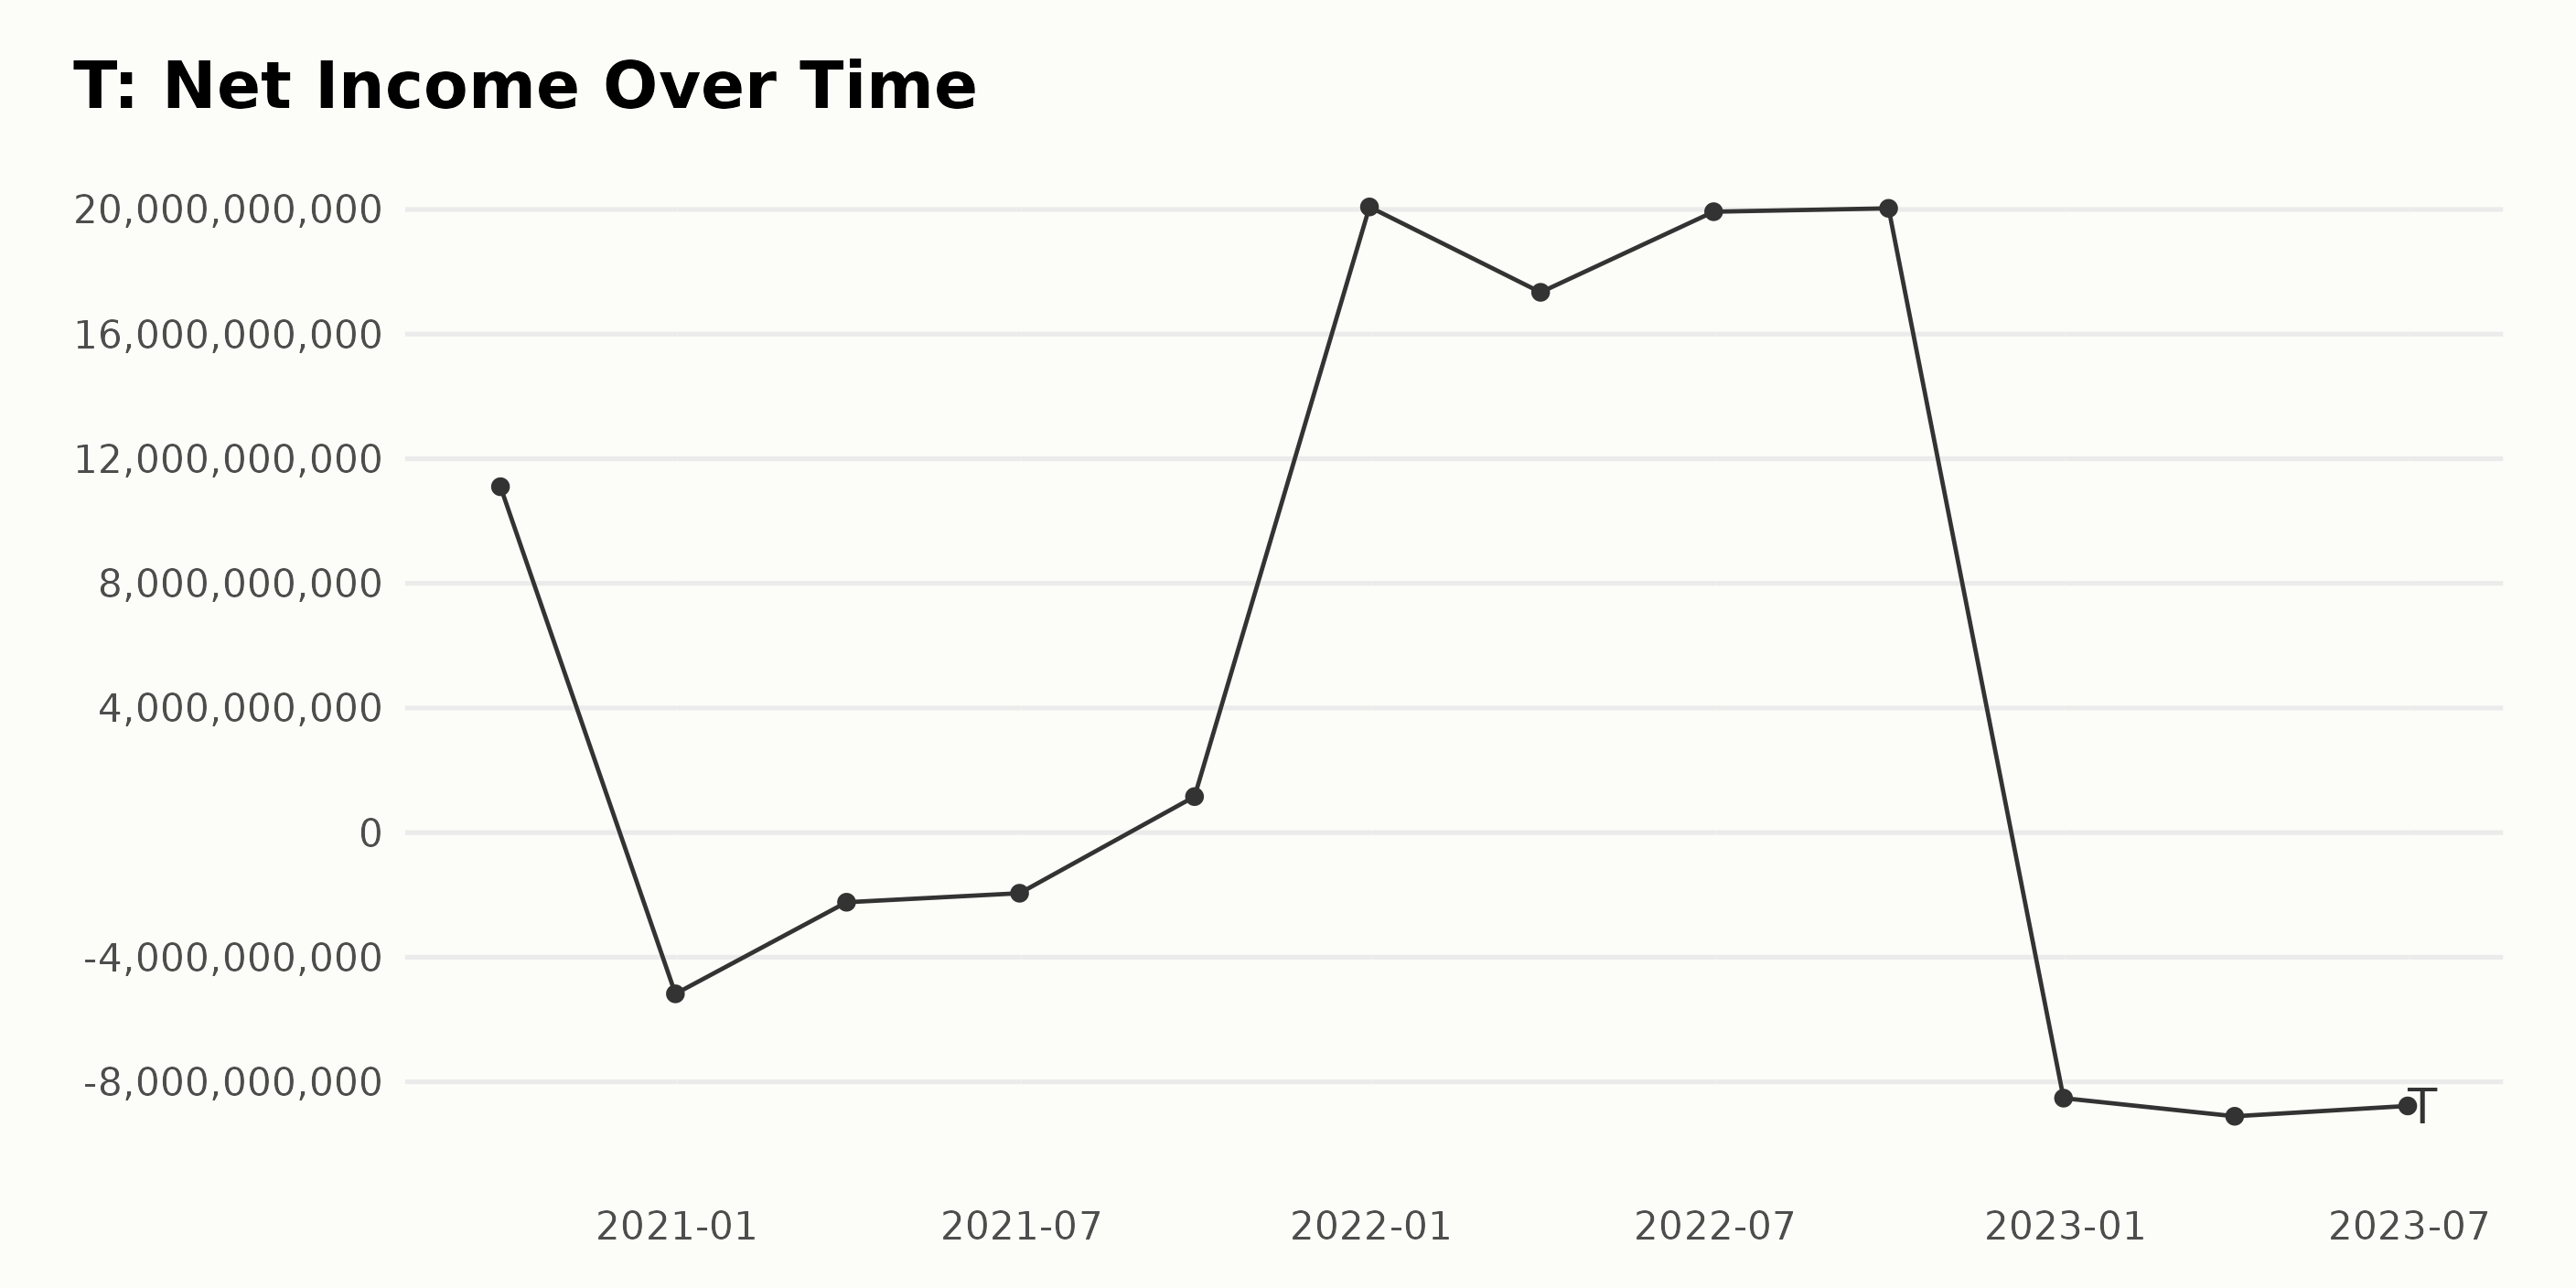
The following provides a summary of T’s trailing-12-month net income trend and fluctuations:
- On September 30, 2020, the net income stood at $11.01 billion. However, there was a significant drop by the end of the year on December 31, 2020, when the net income went into a deficit of -$5.17 billion. This trend of negative net income continued until March 31, 2021.
- From the deficit, the company began to recuperate in the second quarter of 2021. By June 30, 2021, the net income slightly improved to -$1.94 billion, before increasing to a positive value of $1.15 billion on September 30, 2021.
- The company saw substantial growth by the end of 2021, with a net income of $20.08 billion. This upward trend was consistent through the first three quarters of 2022, culminating in a net income of $20.03 billion on September 30, 2022.
- However, the last quarter of 2022 and the first two quarters of 2023 saw a reversal in fortune. The net income plummeted, hitting a low of -$8.52 billion on December 31, 2022, -$9.10 billion on March 31, 2023, and -$8.77 billion on June 30, 2023, respectively.
Looking at the changes from the first value to the last, net income has had a negative growth rate. Although T made a notable comeback from a deficit in 2020 to a profitable state in 2021 and 2022, the losses experienced towards the end of 2022 and the first half of 2023 surpassed the earlier gains.
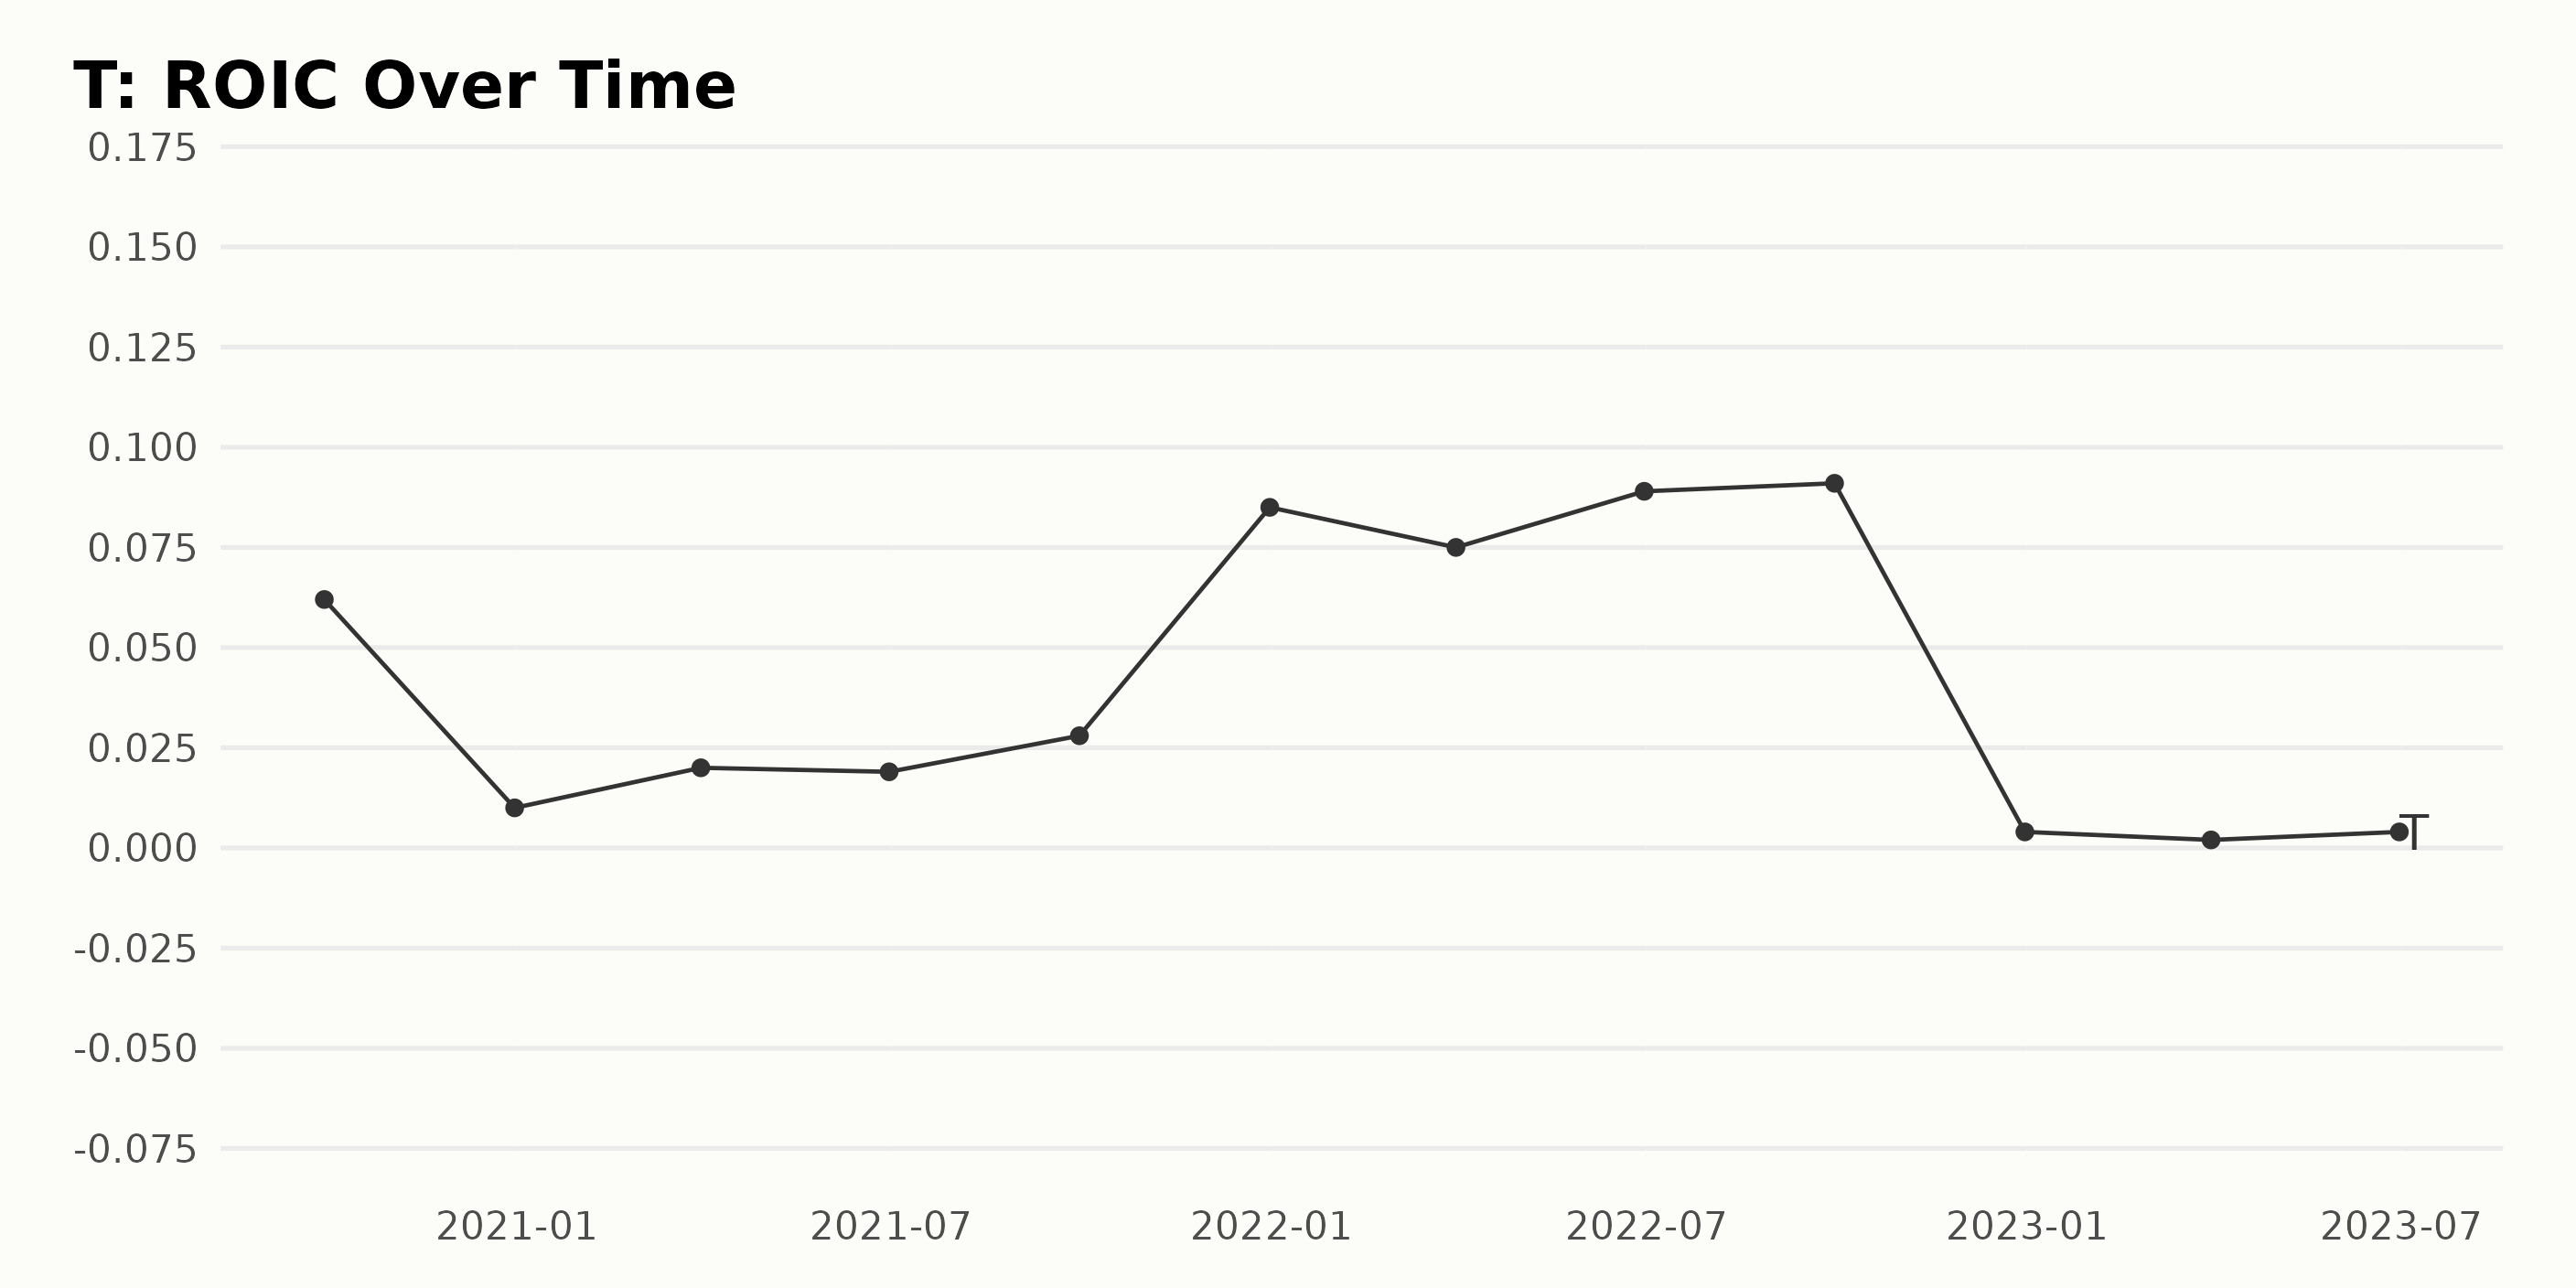
T’s Return On Invested Capital (ROIC) can be seen to fluctuate over time, with significant variance between the quarters observed from late 2020 to mid-2023. The data on the company's ROIC exhibits both an upward trend and considerable volatility during this period.
- As of September 30, 2020, T’s ROIC was 6.2%.
- By December 31, 2020, it had dropped significantly to 1%.
- This metric then mildly recovered to 2% at the end of the first quarter of 2021 before slightly dropping again to 1.9% by June 30, 2021.
- The ROIC rebounded noticeably, reaching 2.8% in September 2021 and reached a peak of 8.5% by the end of the year.
- Despite a slight drop to 7.5% in March 2022, T’s ROIC saw another increase to 8.9% by June 2022 and peaked at 9.1% by September 2022.
- The biggest drop occurred in the last quarter of 2022, where the ROIC plummeted to 0.4% on December 31, maintaining a low value into 2023, hovering around 0.2% to 0.4%.
Between the initial value date (September 30, 2020) and the final date (June 30, 2023), the growth rate represents a negative trend, declining by approximately -92%. That said, it's evident that the T’s ROIC within the analyzed period was characterized by a series of rises and falls, which culminated in an overall decrease from the original figure.
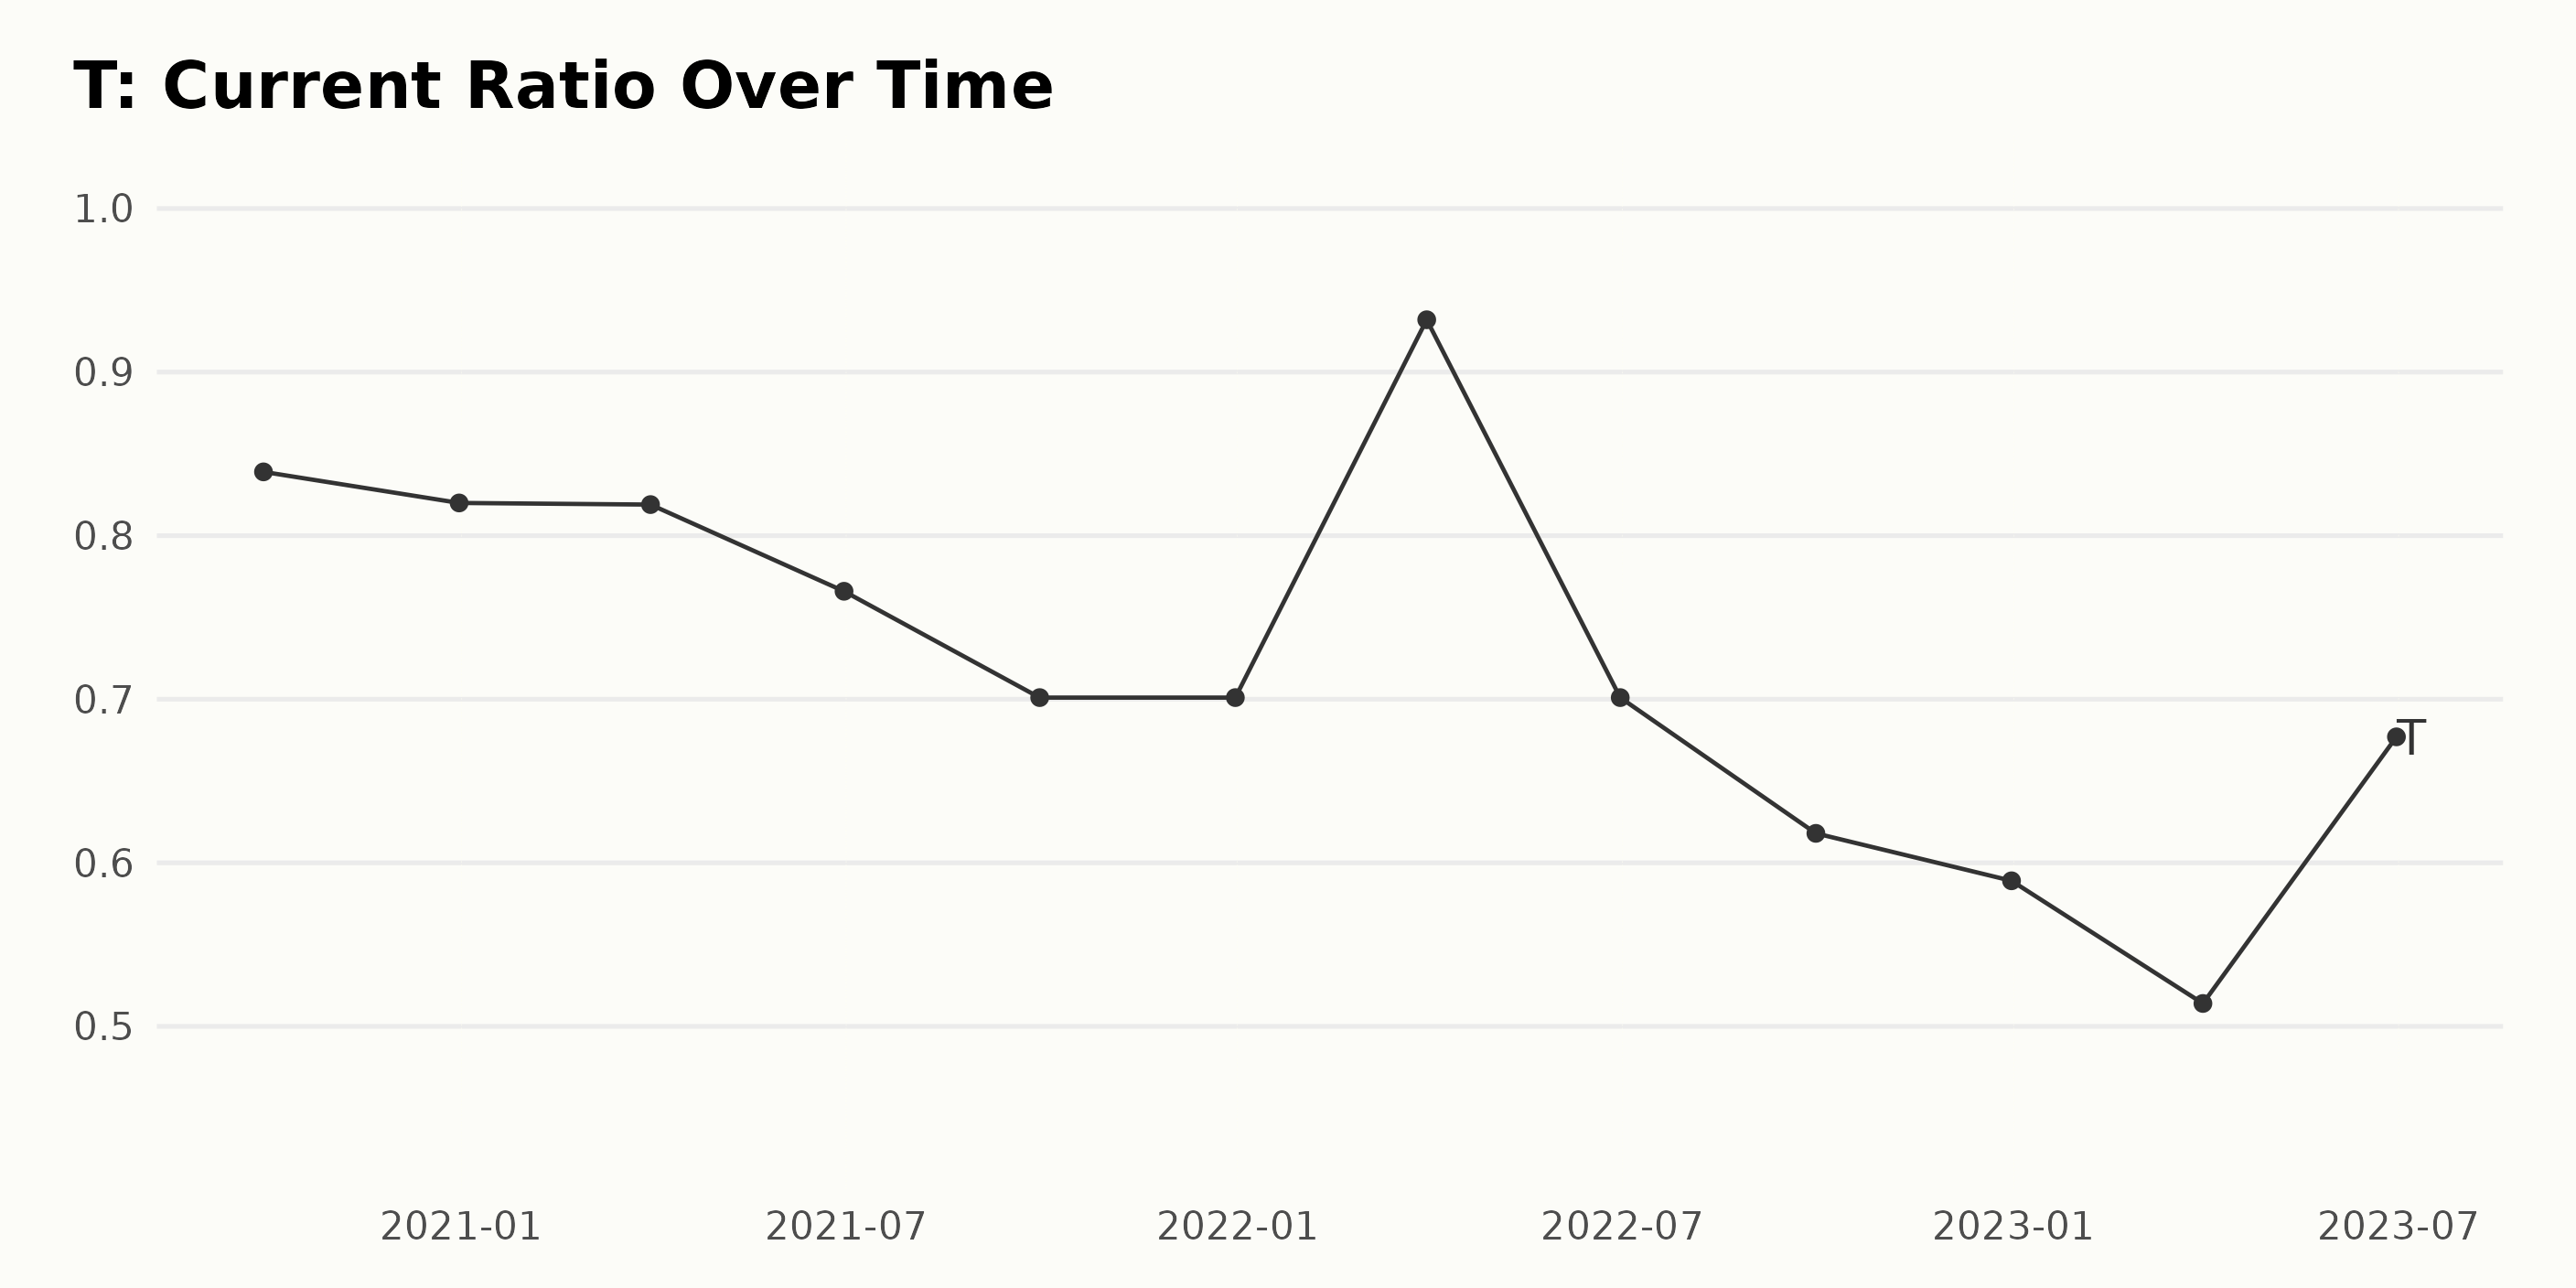
The data encapsulates T’s Current Ratio (CR) trend and fluctuations for a timeframe beginning September 30, 2020, to June 30, 2023.
- As of September 30, 2020, T had a CR of 0.84.
- A slightly declining trend was observed as the CR value fell to 0.82 by December 31, 2020. This continued well into 2021, decelerating to 0.82 in the first quarter, 0.77 by mid-year, and nearly consistent at 0.70 for the third quarter and year-end.
- In early 2022, the CR experienced an unusual hike as it catapulted to 0.93 by the end of the first quarter. However, it experienced an abrupt fall by the mid-year, dropping to 0.70.
- The latter part of 2022 recorded a further decline, with the ratio closing the year at 0.59, a significantly lesser value than at the beginning of the year.
- Throughout the first half of 2023, there were fluctuations. The CR dropped to a low of 0.51 in March but undertook a rebound by June to 0.68.
In terms of growth rate, there is an approximately 19% decrease when comparing the initial Current Ratio value of 0.84 on September 30, 2020, to 0.68 on June 30, 2023, indicating a weakening liquidity position.
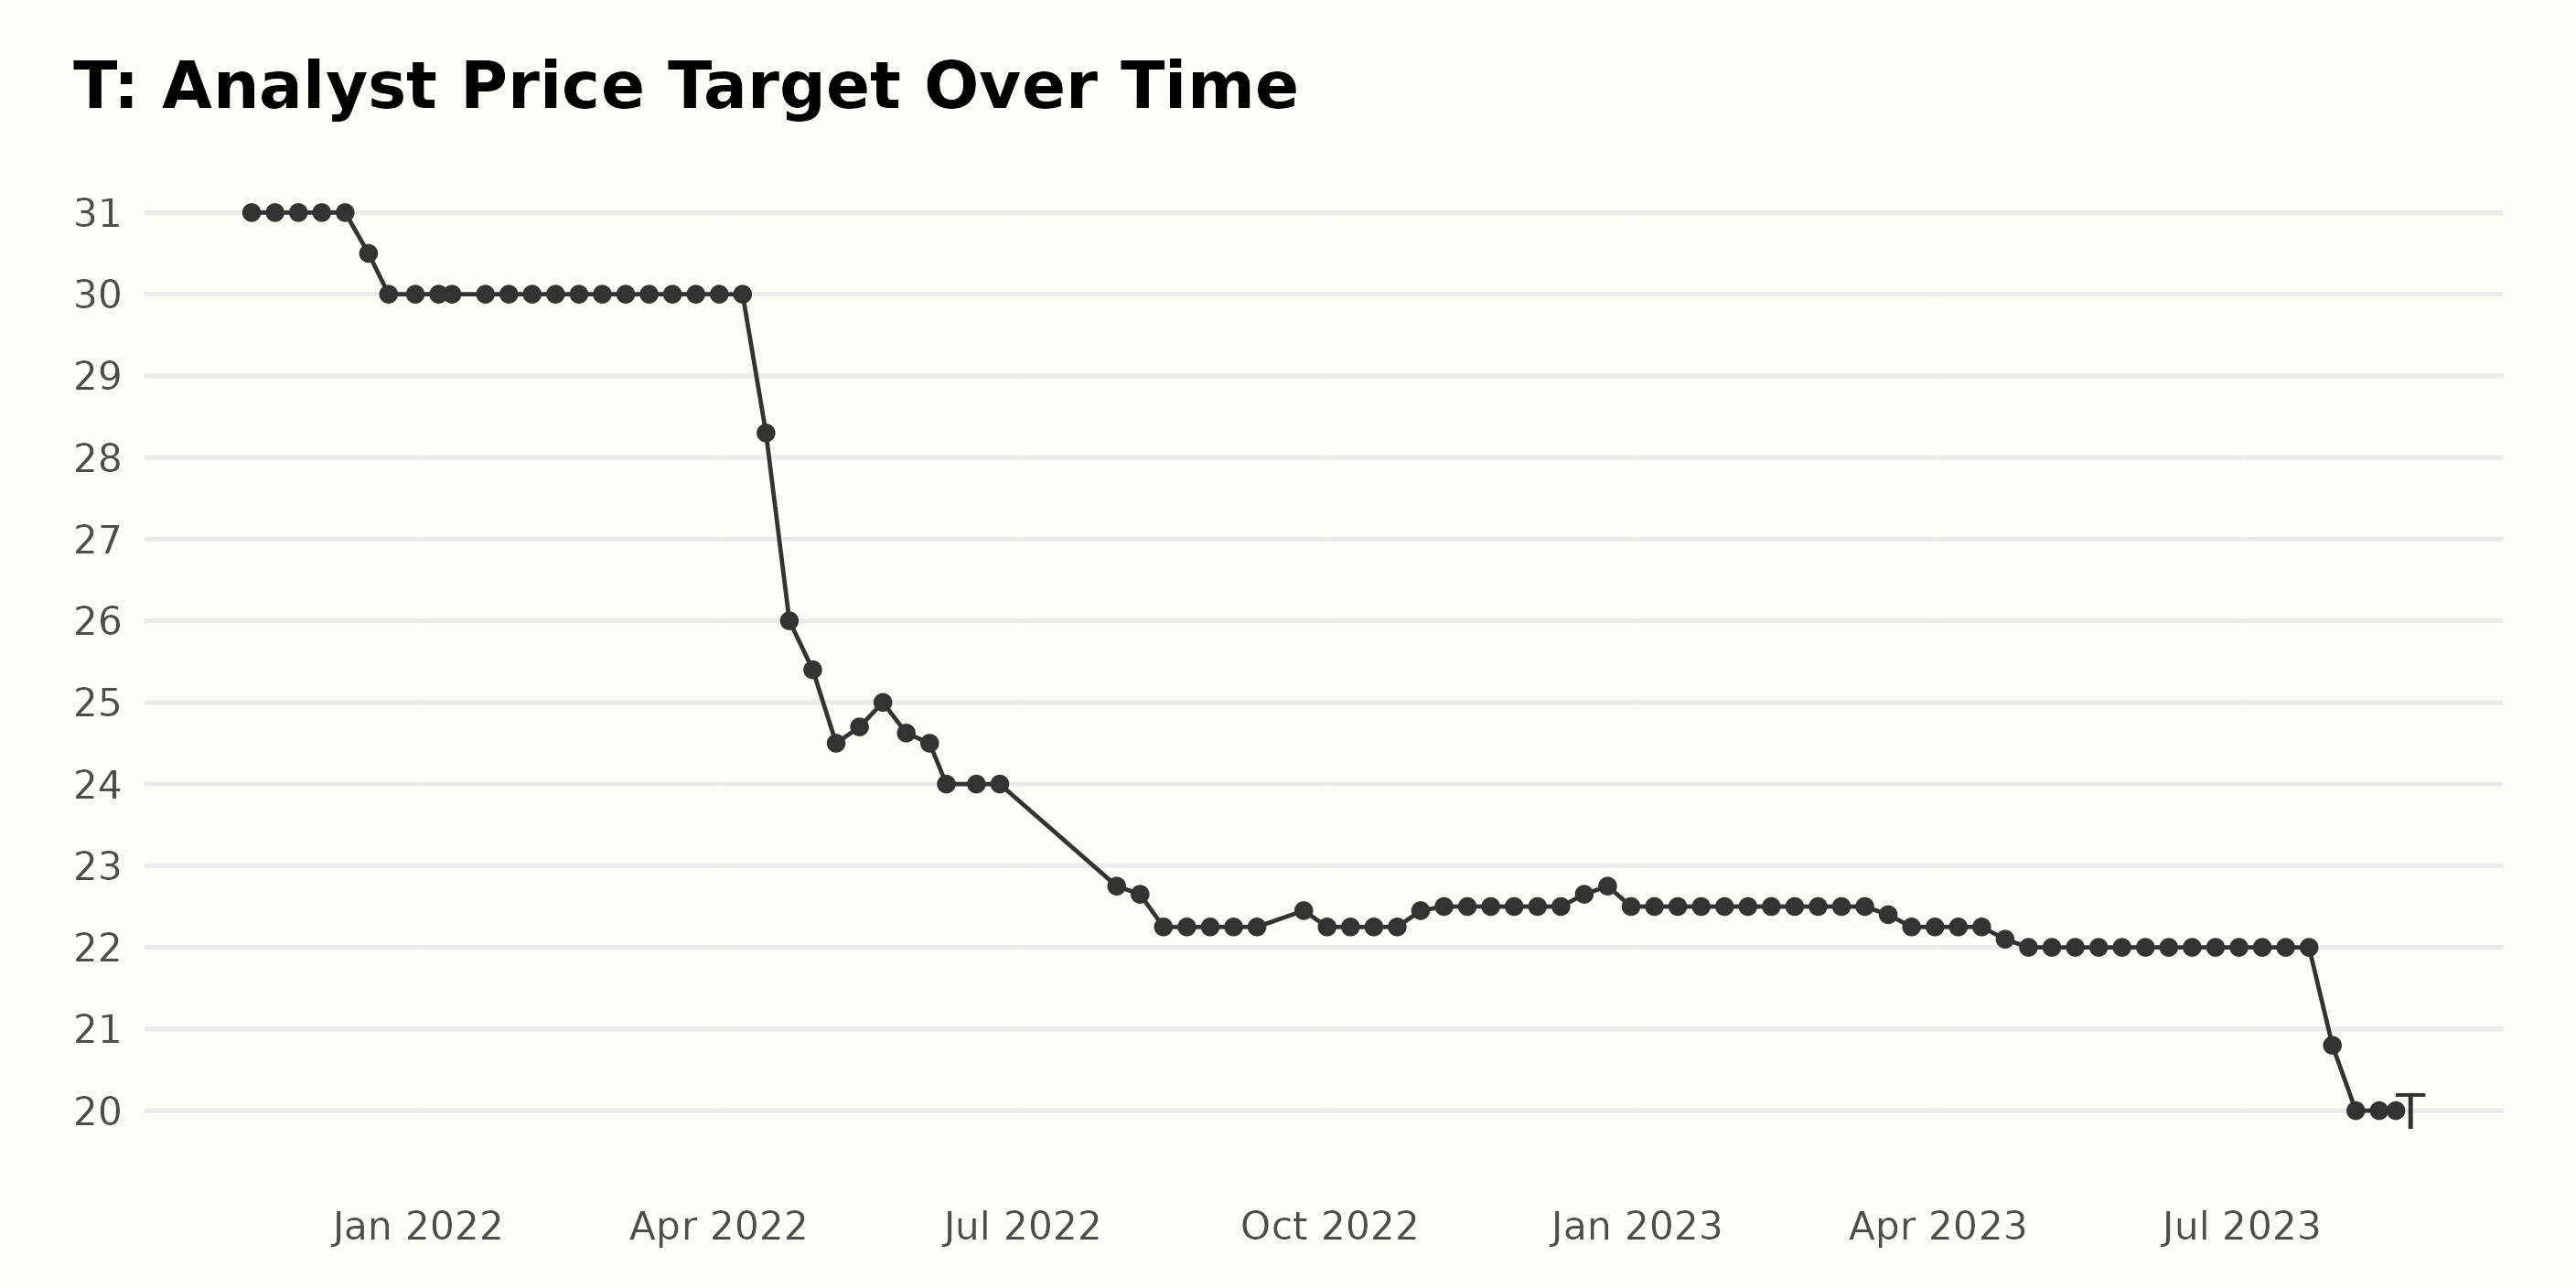
Let's analyze the Analyst Price Target for T from November 2021 to August 2023:
- T’s Analyst Price Target remained stable at $31 from November 12, 2021, until December 10, 2021.
- We notice a gradual decrease in the price target starting from December 17, 2021, when it dropped to $30.5. It then fluctuated several times before setting at $22.5 on November 4, 2022.
- The trend of slight fluctuation continues with minor ups and downs, and by March 17, 2023, the Analyst Price Target has decreased to $22.4.
- There was a significant drop in the Analyst Price Target towards the end of the analysis period. It went down to $20.8 by July 28, 2023, and subsequently declined further to $20 by August 04, 2023, which is the last data point of the series.
Overall, the Analyst Price Target for AT&T has decreased by about 35% from November 2021 to August 2023.
Growth Rate: The growth rate calculation considers the first and last values of the data set. The initial value is $31 (November 12, 2021), and the final value is $20 (August 16, 2023). This indicates a negative growth rate of 35.5%.
T's Share Price: A Detailed Analysis of Declining Trends in 2023
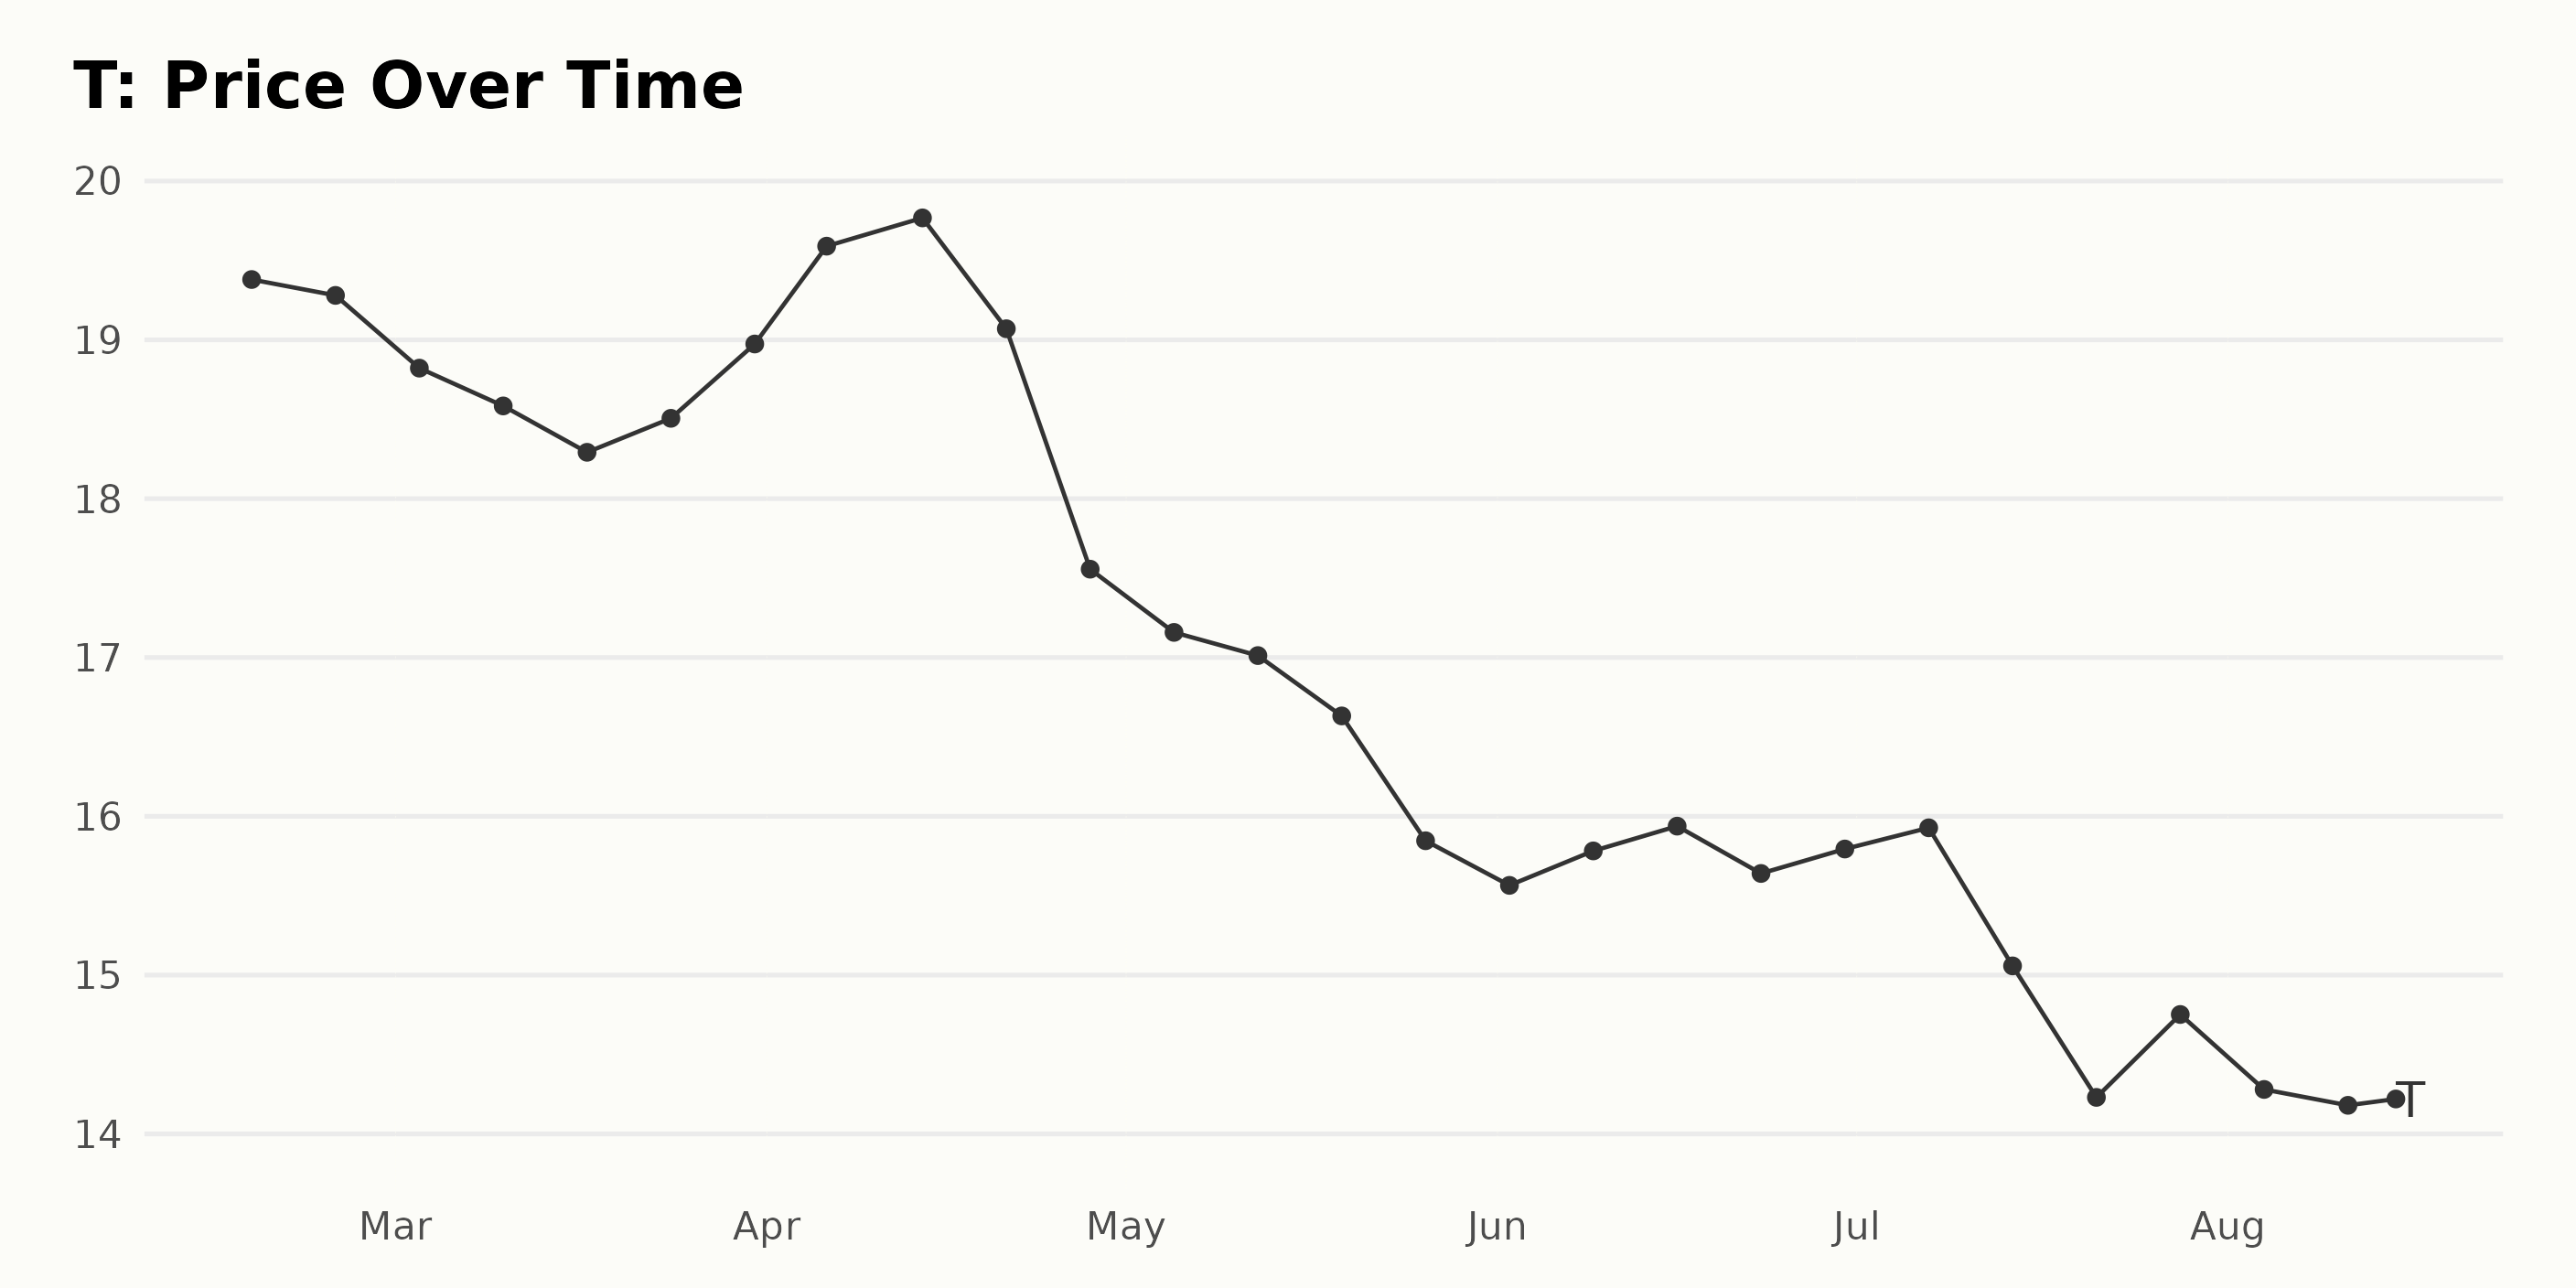
Upon analyzing the data, we observe a declining trend in the share price of T from February to August 2023. Here's a breakdown:
- In February 2023, T's share price dipped slightly from $19.38 (February 17, 2023) to $19.28 (February 24, 2023).
- The declining trend continued in March, with the share price dropping from $18.82 (March 3, 2023) slowly down to $18.29 (March 17, 2023), followed by a slight increase ending the month at $18.97 (March 31, 2023).
- In April, the price initially rose to a highpoint of $19.77 (April 14, 2023) but then experienced a significant drop to end the month at $17.56 (April 28, 2023).
- A continuous decline is seen in May, with the price falling from $17.16 (May 5, 2023) to $15.85 (May 26, 2023).
- June brought a momentary stabilization, with the price fluctuating between $15.57 (June 2, 2023) and $15.79 (June 30, 2023).
- However, the overall declining pattern resumed in July, starting at $15.93 (July 7, 2023) and dropping to $14.23 (July 21, 2023), with a minor bounce back to $14.75 (July 28, 2023) towards the end of the month.
- The price continued to drift downwards in August, concluding at $14.22 (August 15, 2023).
From this data, it appears that T's share prices are in a decelerating trend across the span from February until August 2023. The growth rate in each interval cannot be calculated accurately based on the given data since it is not provided whether the time intervals are regular. Nonetheless, an overall declining trend is apparent, demonstrating negative growth for T. And the rate of decline seems to increase over the specified period. Here is a chart of T's price over the past 180 days.
Assessing T’s POWR Ratings
T has an overall C rating, translating to a Neutral in our POWR Ratings system. Among the 18 stocks in the Telecom - Domestic industry, T is ranked #8.
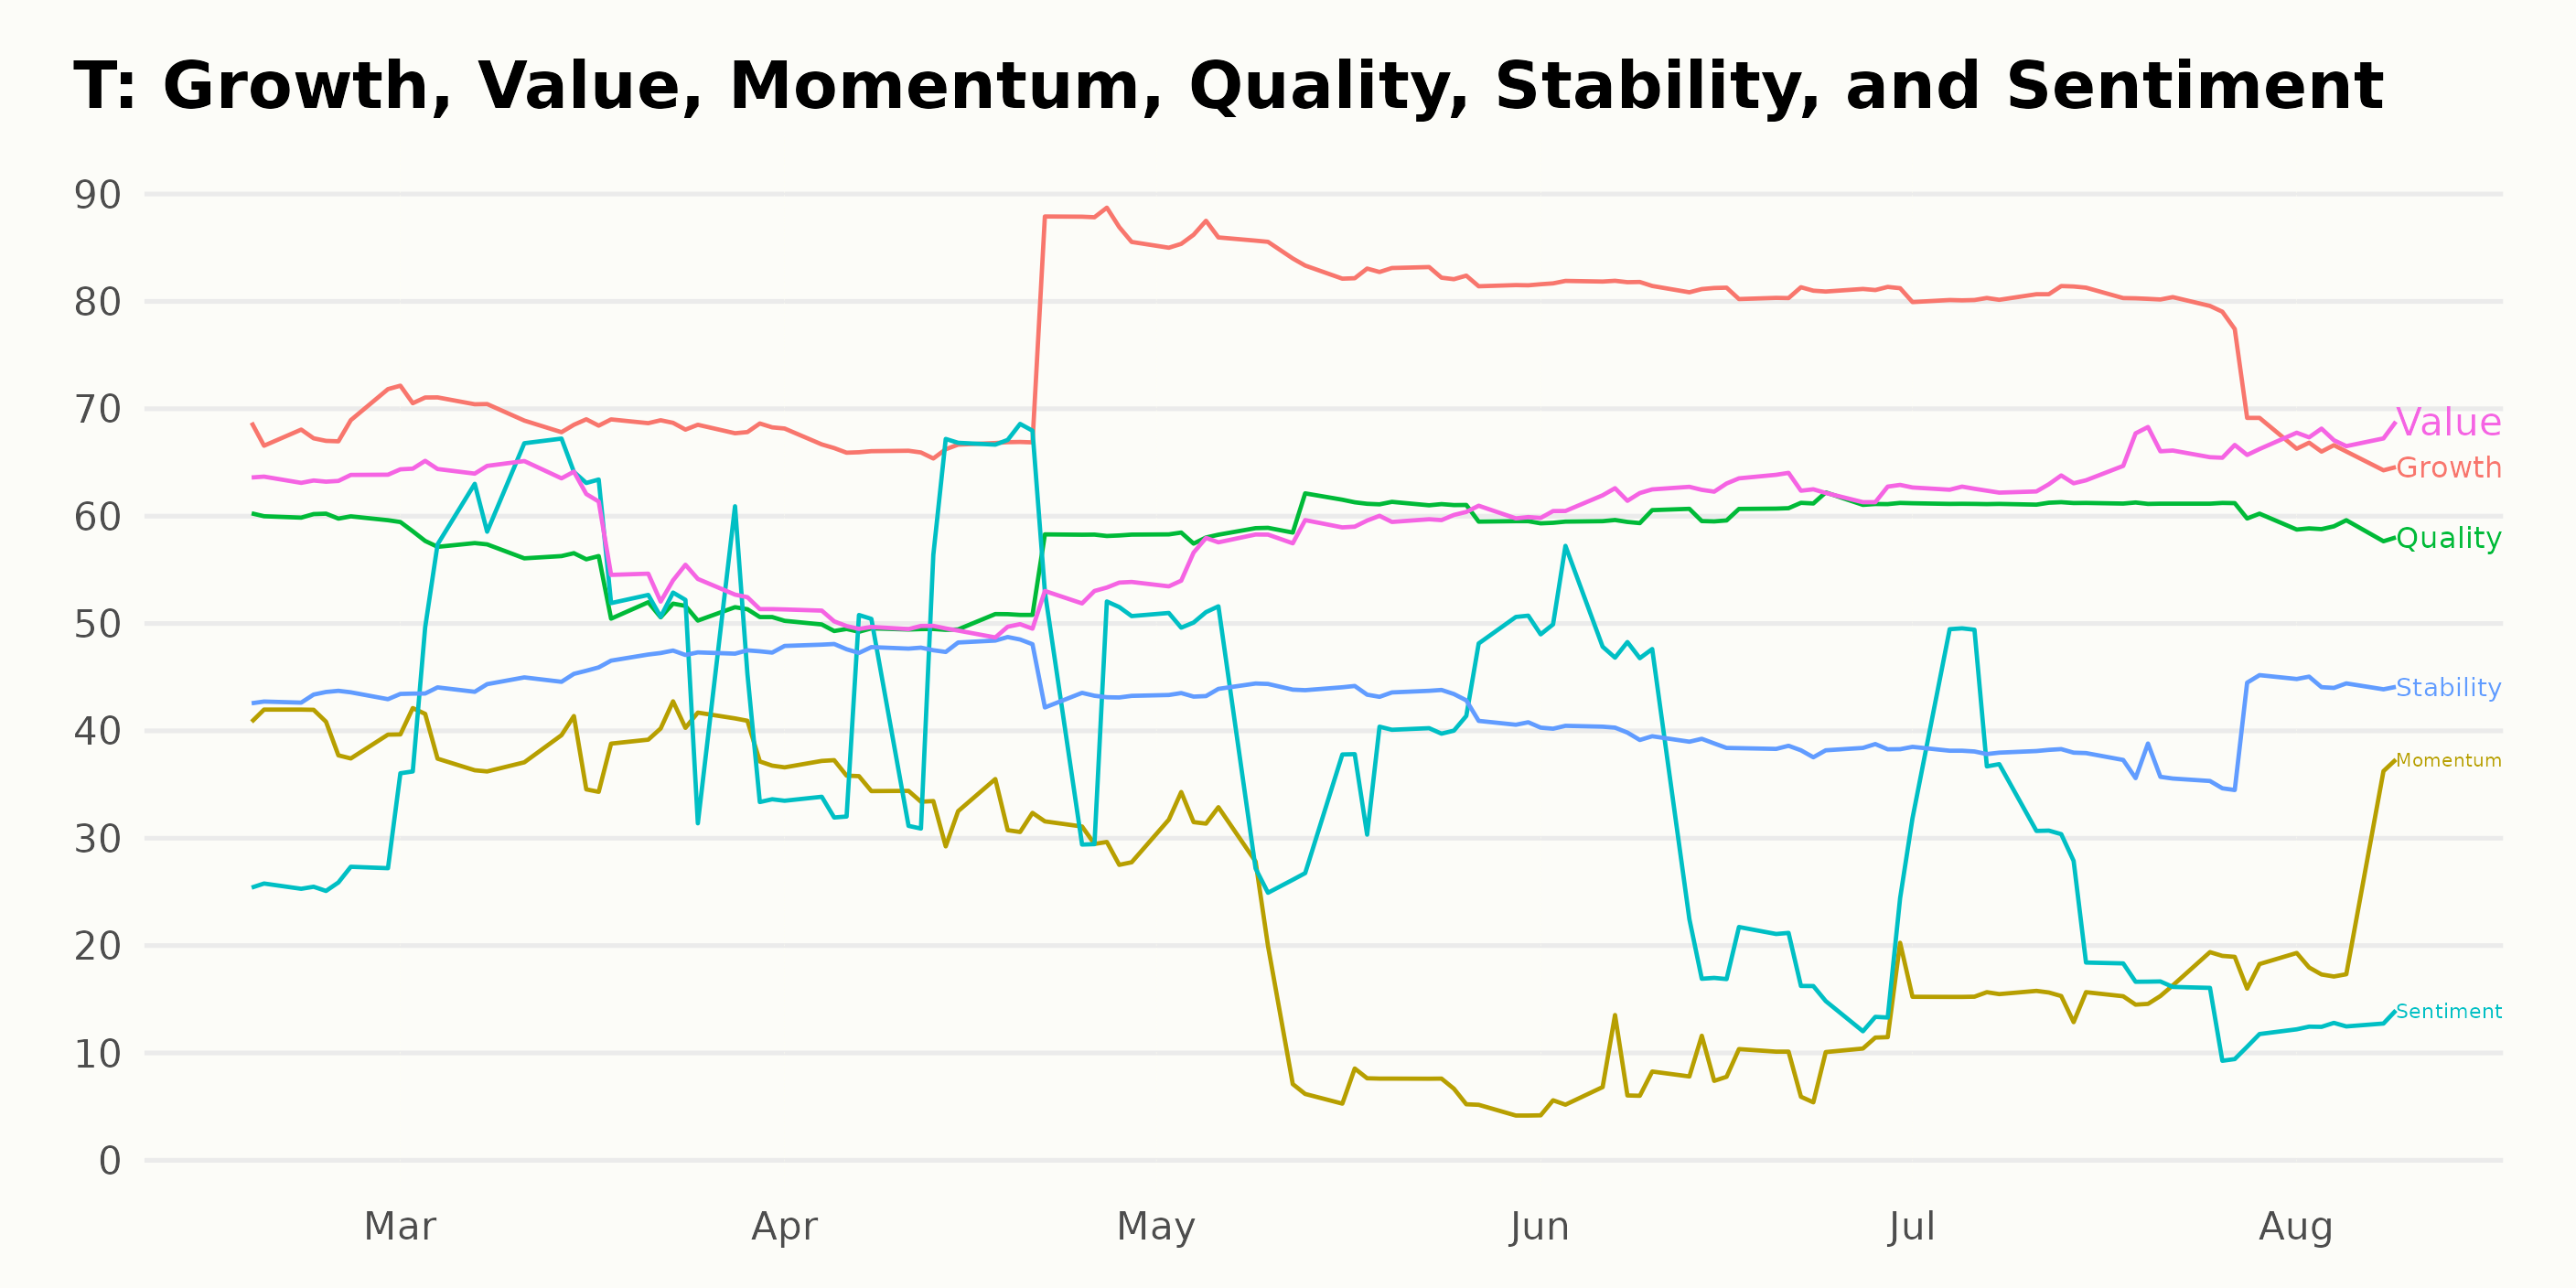
Data from the POWR Ratings reveals some noteworthy trends along three main dimensions - Growth, Quality, and Value. The following discussion is focused on the trends within these dimensions, highlighting those with the highest ratings.
- Growth: The growth dimension for T witnessed an impressive escalation from February to May 2023, where the value surged from 68 to 84. This represents a strong growth potential for T. However, post its peak in May 2023, growth started declining, reaching a value of 66 by August 9, 2023.
- Quality: The quality rating displayed a rather consistent performance over the noted period - starting at a rating of 60 in February 2023, distinctly dropping to 52 in March and April, but then rebounding to 60 by May and maintaining around this level through August. This suggests that the quality of the company's fundamentals remained stable for the most part.
- Value: T’s value rating showed mixed results throughout the given timeframe. Starting off at 63 in February 2023, it dropped to 51 by April. However, it showed substantial recovery in the following months, rising steadily to reach a value of 68 in August 2023, which is the highest among the other two dimensions considered herein.
The data indicates a phenomenon of contrasting trends - while growth was seen peaking and then declining, the value aspect saw a dip and subsequent climb, demonstrating the dynamism inherent in the stock market.
How does AT&T Inc. (T) Stack Up Against its Peers?
Other stocks in the Telecom - Domestic sector that may be worth considering are Ooma Inc. (OOMA), Spok Holdings Inc. (SPOK), and IDT Corporation (IDT) -- they have better POWR Ratings.
What To Do Next?
Discover 10 widely held stocks that our proprietary model shows have tremendous downside potential. Please make sure none of these “death trap” stocks are lurking in your portfolio:
T shares fell $0.01 (-0.07%) in premarket trading Wednesday. Year-to-date, T has declined -19.63%, versus a 16.63% rise in the benchmark S&P 500 index during the same period.
About the Author: Kritika Sarmah

Her interest in risky instruments and passion for writing made Kritika an analyst and financial journalist. She earned her bachelor's degree in commerce and is currently pursuing the CFA program. With her fundamental approach, she aims to help investors identify untapped investment opportunities.
The post Is it Possible for AT&T Inc. (T) to Become a Buy This Month? appeared first on StockNews.com