
Over the past couple of months, a ‘Head and Shoulders’ pattern has developed in the chart of Globus Medical Inc. (GMED).
GMED is a medical device company that develops products for patients with musculoskeletal disorders. Their products include implantable devices and surgical instruments used in orthopedic and spinal procedures. The company’s revenue and earnings have grown regularly over the past few years.
The company has also developed a robotic platform called ExcelsiusGPS. The platform employs big data to improve surgical precision. The platform is also expected to support augmented reality and artificial intelligence.
Like most stocks, GMED hit a 52-week low in March as the coronavirus pandemic spread throughout the world. Since then, it’s been quite volatile - trending higher in April and May, and lower in June and July.
As you can see in the chart below, there is a level of support (red) that has formed at $44:
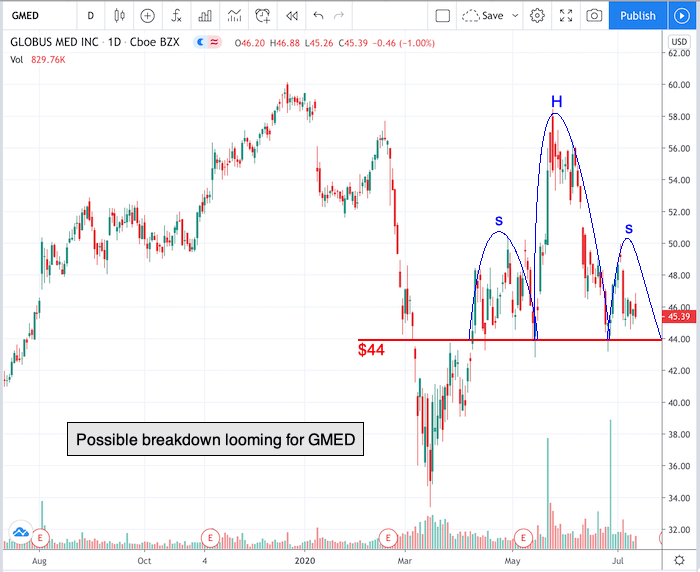
Chart of GMED provided by TradingView
The $44 support level is also the “neckline” for this head and shoulder pattern. A head and shoulders pattern is a chart formation that technical analysts use to locate areas/prices at which increased momentum to the upside or downside should occur.
In this case, the first shoulder (blue) in GMED was in April/May, the head was in May/June, and the second shoulder is now forming in July.
If GMED breaks below the neckline/support level of $44, there is a good chance that we will see a breakdown in the stock. Therefore, a trader could short GMED under $44 and expect to see momentum to the downside.
Have a good trading day!
Good luck!
Christian Tharp, CMT
Follow me on Twitter: @cmtstockcoach
Stock Trading & Investing for Everyone
Want More Great Investing Ideas?
9 “BUY THE DIP” Growth Stocks for 2020
Top 5 WINNING Stock Chart Patterns
7 “Safe-Haven” Dividend Stocks for Turbulent Times
GMED shares were trading at $45.11 per share on Tuesday morning, down $0.28 (-0.62%). Year-to-date, GMED has declined -23.39%, versus a -1.79% rise in the benchmark S&P 500 index during the same period.
About the Author: Christian Tharp

Christian is an expert stock market coach at the Adam Mesh Trading Group who has mentored more than 4,000 traders and investors. He is a professional technical analyst that is a certified Chartered Market Technician (CMT), which is a designation awarded by the CMT Association. Christian is also the author of the daily online newsletter Todays Big Stock.
The post Chart of the Day: Globus Medical (GMED) appeared first on StockNews.com