
 ( click to enlarge )
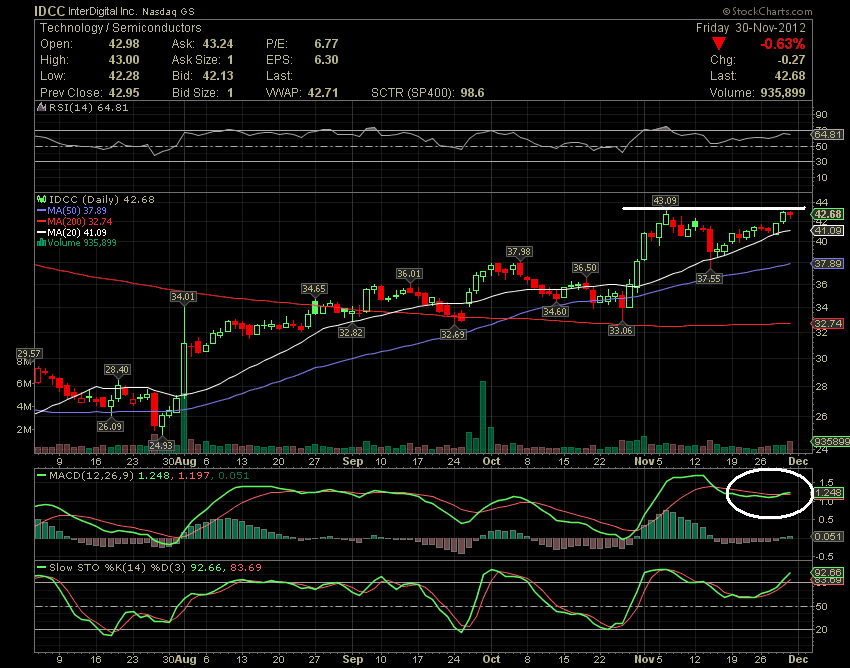
I've been bringing InterDigital, Inc.(NASDAQ:IDCC) to my readers the last few months and the stock is again on the verge of a possible breakout. For the coming week, watchout for a possible breakout over $43.09 which is the previous high. Based on a technical perspective the stock shows very strong bullish sign. First of all, the stock is trading above 20/50-day and 200-day moving average with all major moving averages pointing upwards. Then the daily MACD indicator is back above signal line also indicating a buy. In addition, KD line still show the stock is on the positive swing. The short interest remains high at over 13 percent and shorts will need more than 9 days to cover. So, if it breaks above the 43.09 level then a squeeze definitely will happen. I'll be watching the stock again on Monday for a possible Breakout.
 ( click to enlarge )
ITT Educational Services, Inc.(NYSE:ESI) stock pulled back after an oversold rally. Resistance on the upside is located at 19.14 followed by 20 and 21.10. Support on the downside is located at 17.84 followed by 17.43 and 16.37. Stochastics are creating higher highs and also curling up from the oversold level. ESI shows signs of bottoming out, gaining 10% from it's 52 week low in the last sessions. Looking like a nice play here.
 ( click to enlarge )
VirnetX Holding Corporation (NYSEAMEX:VHC) is facing a key resistance at $35.25 level. The short-term uptrend is intact and signals further bullishness on this stock. From a technical standpoint the stock is in a strong bull market with MACD on top of signal and %K line on top of %D line indicating buy signal. Buy the stock in dips with tight stop-loss at$31.96.
 ( click to enlarge )
Research In Motion Limited (NASDAQ:RIMM) has been one of the hottest stocks around, trading up from $8.00 to its current price of $11.60, all this month. Shares may be in a consolidation phase following a nice trend. Keep an eye for a possible breakout over $12.30.
 ( click to enlarge )
Looking at the technical chart the trend is beginning to shift towards bullish and a possible long entry can be taken if $1.60 provides support. From here, we can expect a run to the $2.02 level and from there we could see an explosive upsurge to $3, but tight stops should be used.
During the day I tweet many times to my readers. I encourage everybody to subscribe AC Investor Blog twitter and newsletter, so you can receive my trade ideas and stock news in real time.
Disclaimer : This is not an investment advisory, and should not be used to make investment decisions. Information in AC Investor Blog is often opinionated and should be considered for information purposes only. No stock exchange anywhere has approved or disapproved of the information contained herein. There is no express or implied solicitation to buy or sell securities. The charts provided here are not meant for investment purposes and only serve as technical examples. Don't consider buying or selling any stock without conducting your own due diligence.
Thanks for visiting AC Investor Blog.
AC
