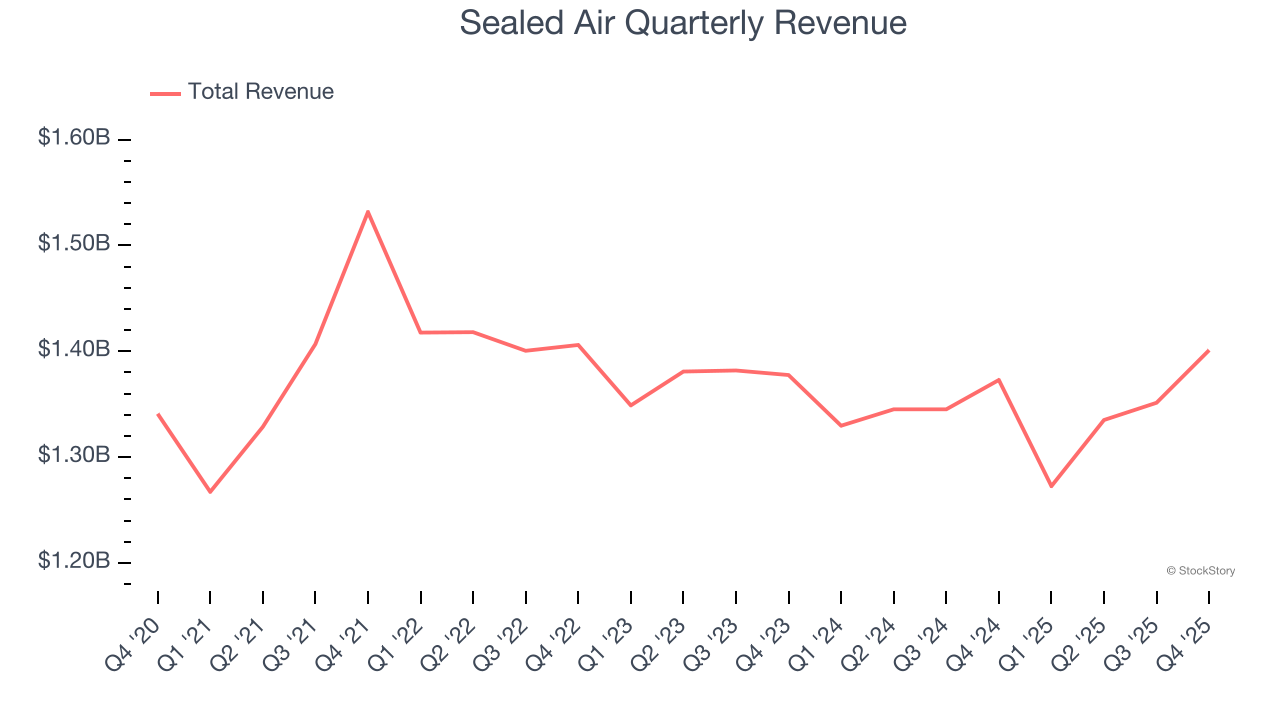
Integrated packaging solutions provider Sealed Air Corporation (NYSE: SEE) announced better-than-expected revenue in Q4 CY2025, with sales up 2.1% year on year to $1.4 billion. Its non-GAAP profit of $0.77 per share was 5.4% above analysts’ consensus estimates.
Is now the time to buy Sealed Air? Find out by accessing our full research report, it’s free.
Sealed Air (SEE) Q4 CY2025 Highlights:
- Revenue: $1.4 billion vs analyst estimates of $1.35 billion (2.1% year-on-year growth, 3.8% beat)
- Adjusted EPS: $0.77 vs analyst estimates of $0.73 (5.4% beat)
- Adjusted EBITDA: $278 million vs analyst estimates of $272.2 million (19.8% margin, 2.1% beat)
- Operating Margin: 11.4%, in line with the same quarter last year
- Free Cash Flow Margin: 18.4%, up from 13.5% in the same quarter last year
- Sales Volumes fell 1% year on year (1% in the same quarter last year)
- Market Capitalization: $6.17 billion
Company Overview
Founded in 1960, Sealed Air Corporation (NYSE: SEE) specializes in the development and production of protective and food packaging solutions, serving a variety of industries.
Revenue Growth
Examining a company’s long-term performance can provide clues about its quality. Even a bad business can shine for one or two quarters, but a top-tier one grows for years. Regrettably, Sealed Air’s sales grew at a sluggish 1.8% compounded annual growth rate over the last five years. This was below our standards and is a tough starting point for our analysis.
We at StockStory place the most emphasis on long-term growth, but within industrials, a half-decade historical view may miss cycles, industry trends, or a company capitalizing on catalysts such as a new contract win or a successful product line. Sealed Air’s performance shows it grew in the past but relinquished its gains over the last two years, as its revenue fell by 1.2% annually. 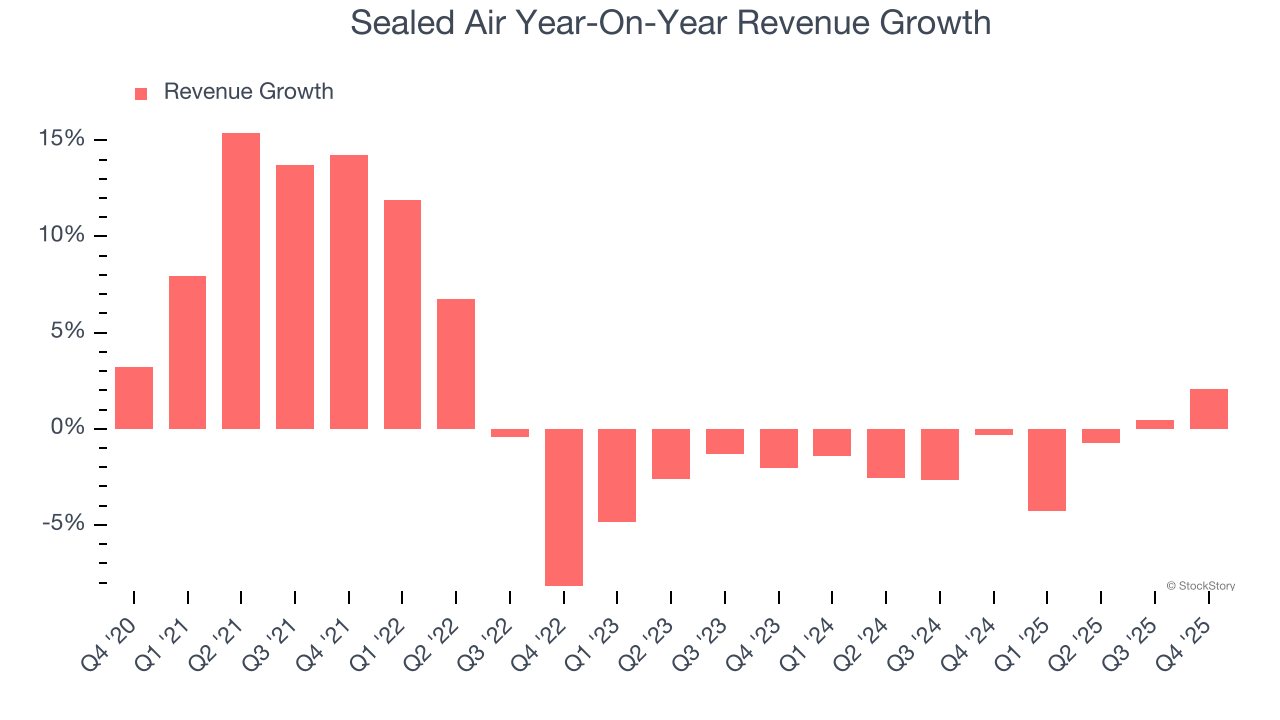
Sealed Air also reports its number of units sold. Over the last two years, Sealed Air’s units sold were flat. Because this number is in line with its revenue growth, we can see the company kept its prices fairly consistent. 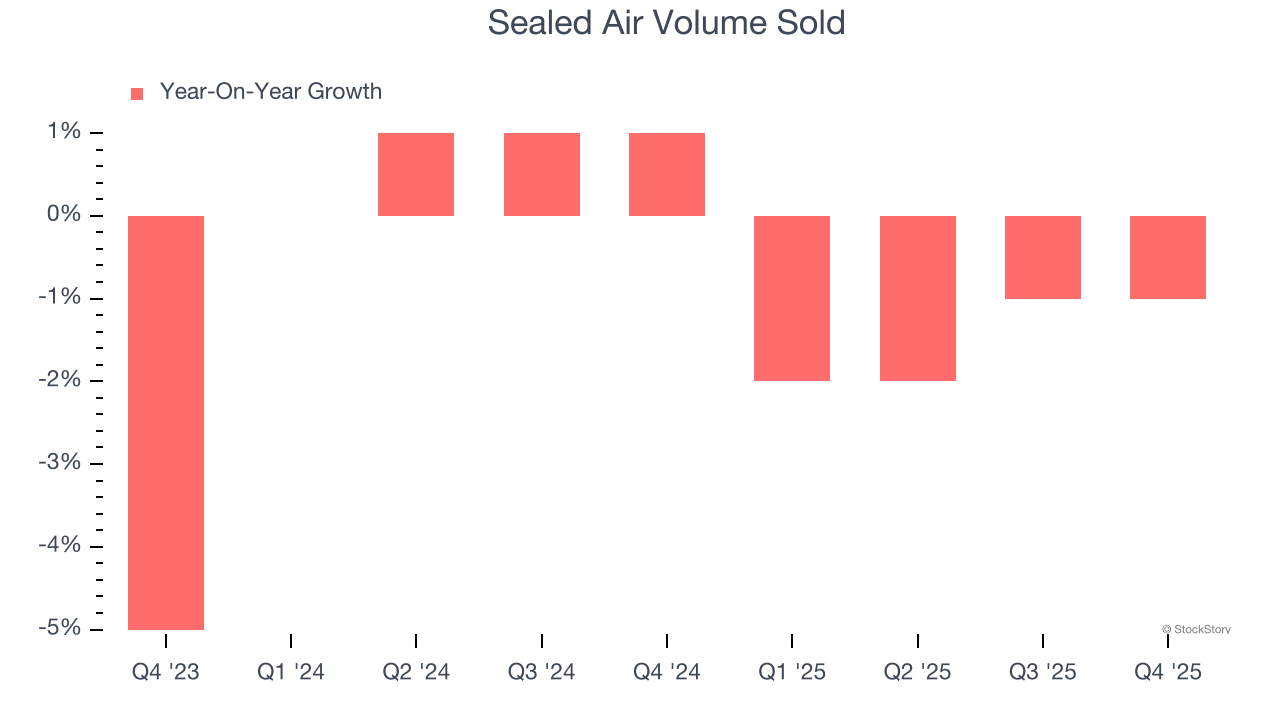
This quarter, Sealed Air reported modest year-on-year revenue growth of 2.1% but beat Wall Street’s estimates by 3.8%.
Looking ahead, sell-side analysts expect revenue to remain flat over the next 12 months. While this projection implies its newer products and services will spur better top-line performance, it is still below the sector average.
While Wall Street chases Nvidia at all-time highs, an under-the-radar semiconductor supplier is dominating a critical AI component these giants can’t build without. Click here to access our free report one of our favorites growth stories.
Operating Margin
Sealed Air has been an efficient company over the last five years. It was one of the more profitable businesses in the industrials sector, boasting an average operating margin of 14.8%.
Looking at the trend in its profitability, Sealed Air’s operating margin decreased by 2.7 percentage points over the last five years. This raises questions about the company’s expense base because its revenue growth should have given it leverage on its fixed costs, resulting in better economies of scale and profitability.
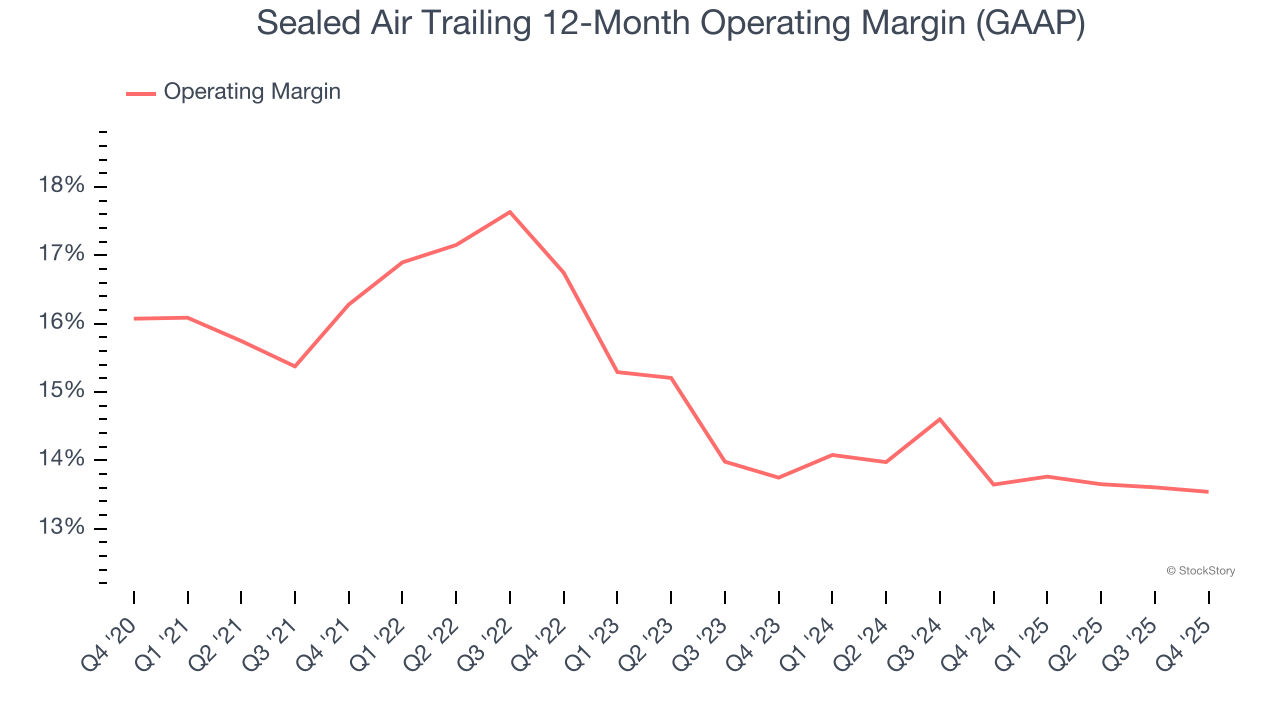
This quarter, Sealed Air generated an operating margin profit margin of 11.4%, in line with the same quarter last year. This indicates the company’s cost structure has recently been stable.
Earnings Per Share
Revenue trends explain a company’s historical growth, but the long-term change in earnings per share (EPS) points to the profitability of that growth – for example, a company could inflate its sales through excessive spending on advertising and promotions.
Sealed Air’s flat EPS over the last five years was below its 1.8% annualized revenue growth. This tells us the company became less profitable on a per-share basis as it expanded due to non-fundamental factors such as interest expenses and taxes.
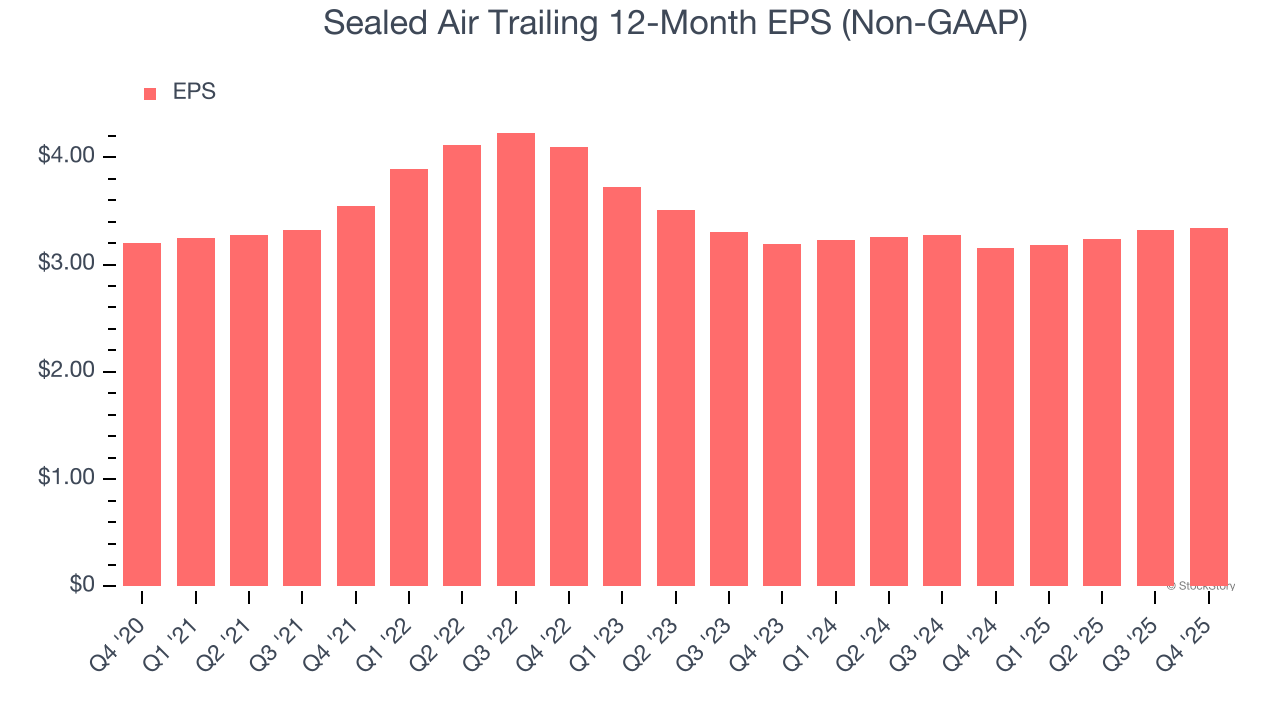
Like with revenue, we analyze EPS over a shorter period to see if we are missing a change in the business.
For Sealed Air, its two-year annual EPS growth of 2.3% was higher than its five-year trend. Accelerating earnings growth is almost always an encouraging data point.
In Q4, Sealed Air reported adjusted EPS of $0.77, up from $0.75 in the same quarter last year. This print beat analysts’ estimates by 5.4%. Over the next 12 months, Wall Street expects Sealed Air’s full-year EPS of $3.34 to grow 1.1%.
Key Takeaways from Sealed Air’s Q4 Results
We were impressed by how significantly Sealed Air blew past analysts’ revenue expectations this quarter. We were also happy its EBITDA outperformed Wall Street’s estimates. Zooming out, we think this quarter featured some important positives. The stock remained flat at $42.00 immediately following the results.
Indeed, Sealed Air had a rock-solid quarterly earnings result, but is this stock a good investment here? When making that decision, it’s important to consider its valuation, business qualities, as well as what has happened in the latest quarter. We cover that in our actionable full research report which you can read here (it’s free).