Speciality material and gas containment company Luxfer (NYSE: LXFR) fell short of the market’s revenue expectations in Q4 CY2025, with sales falling 12.3% year on year to $90.7 million. Its non-GAAP profit of $0.24 per share was in line with analysts’ consensus estimates.
Is now the time to buy Luxfer? Find out by accessing our full research report, it’s free.
Luxfer (LXFR) Q4 CY2025 Highlights:
- Revenue: $90.7 million vs analyst estimates of $92.8 million (12.3% year-on-year decline, 2.3% miss)
- Adjusted EPS: $0.24 vs analyst estimates of $0.24 (in line)
- Adjusted EBITDA: $13 million vs analyst estimates of $11.5 million (14.3% margin, 13% beat)
- Adjusted EPS guidance for the upcoming financial year 2026 is $1.13 at the midpoint, missing analyst estimates by 4.7%
- EBITDA guidance for the upcoming financial year 2026 is $52.5 million at the midpoint, in line with analyst expectations
- Operating Margin: 3.6%, down from 9.1% in the same quarter last year
- Free Cash Flow Margin: 13.7%, down from 21.8% in the same quarter last year
- Market Capitalization: $405.4 million
Company Overview
With its magnesium alloys used in the construction of the famous Spirit of St. Louis aircraft, Luxfer (NYSE: LXFR) offers specialized materials, components, and gas containment devices to various industries.
Revenue Growth
A company’s long-term performance is an indicator of its overall quality. Any business can have short-term success, but a top-tier one grows for years. Unfortunately, Luxfer’s 3.4% annualized revenue growth over the last five years was sluggish. This fell short of our benchmark for the industrials sector and is a tough starting point for our analysis.
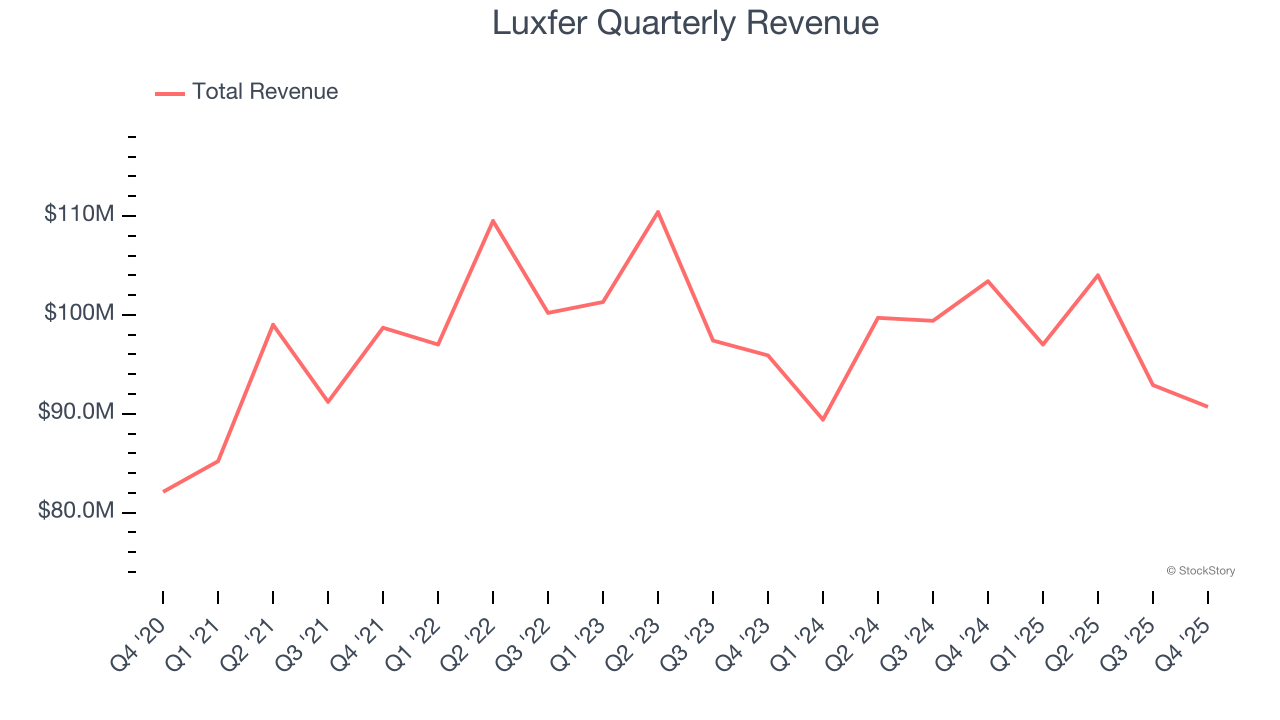
Long-term growth is the most important, but within industrials, a half-decade historical view may miss new industry trends or demand cycles. Luxfer’s performance shows it grew in the past but relinquished its gains over the last two years, as its revenue fell by 2.6% annually. 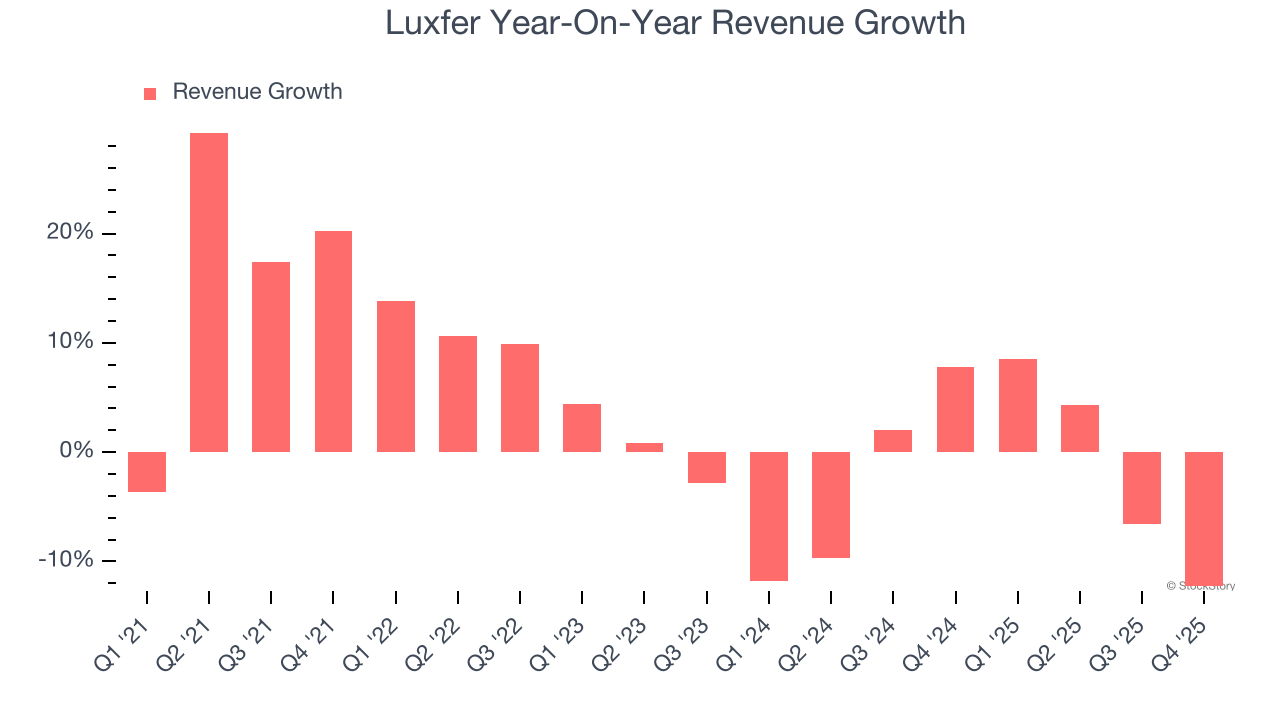
This quarter, Luxfer missed Wall Street’s estimates and reported a rather uninspiring 12.3% year-on-year revenue decline, generating $90.7 million of revenue.
Looking ahead, sell-side analysts expect revenue to remain flat over the next 12 months. Although this projection suggests its newer products and services will spur better top-line performance, it is still below average for the sector.
Software is eating the world and there is virtually no industry left that has been untouched by it. That drives increasing demand for tools helping software developers do their jobs, whether it be monitoring critical cloud infrastructure, integrating audio and video functionality, or ensuring smooth content streaming. Click here to access a free report on our 3 favorite stocks to play this generational megatrend.
Operating Margin
Operating margin is one of the best measures of profitability because it tells us how much money a company takes home after procuring and manufacturing its products, marketing and selling those products, and most importantly, keeping them relevant through research and development.
Luxfer has done a decent job managing its cost base over the last five years. The company has produced an average operating margin of 8.2%, higher than the broader industrials sector.
Analyzing the trend in its profitability, Luxfer’s operating margin decreased by 4.2 percentage points over the last five years. This raises questions about the company’s expense base because its revenue growth should have given it leverage on its fixed costs, resulting in better economies of scale and profitability.
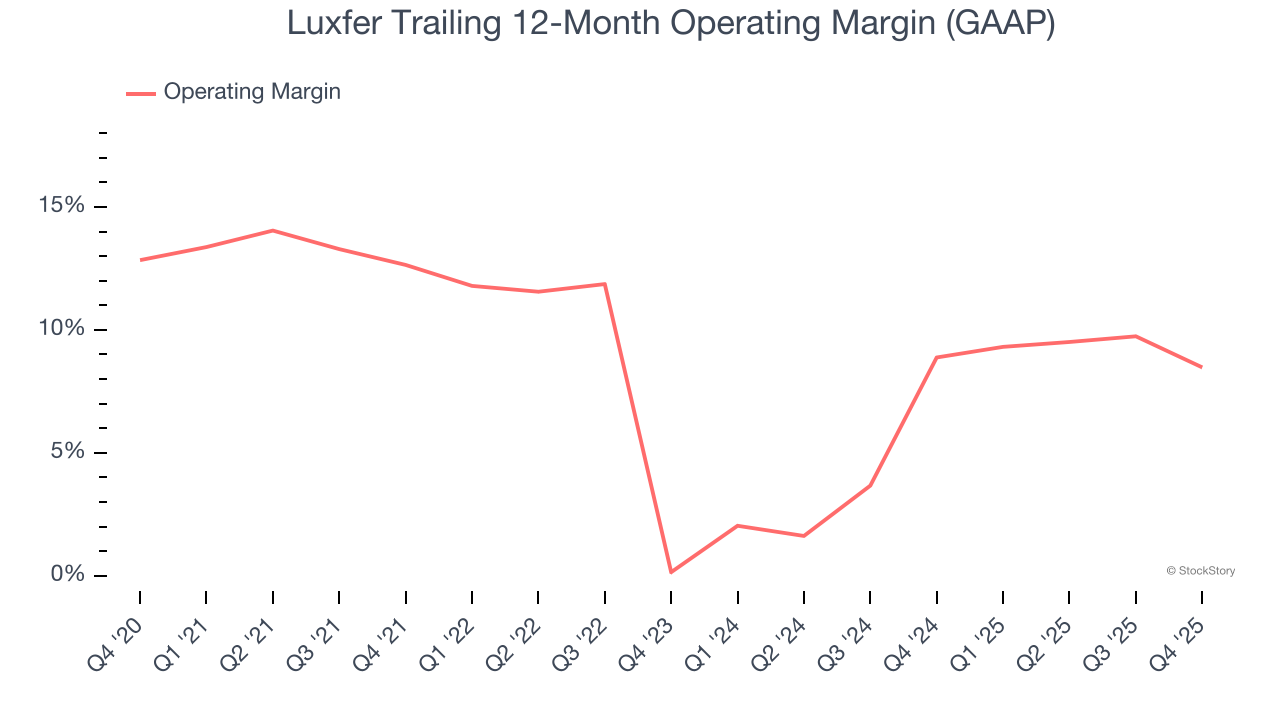
This quarter, Luxfer generated an operating margin profit margin of 3.6%, down 5.5 percentage points year on year. Conversely, its gross margin actually rose, so we can assume its recent inefficiencies were driven by increased operating expenses like marketing, R&D, and administrative overhead.
Earnings Per Share
Revenue trends explain a company’s historical growth, but the long-term change in earnings per share (EPS) points to the profitability of that growth – for example, a company could inflate its sales through excessive spending on advertising and promotions.
Luxfer’s weak 1.6% annual EPS growth over the last five years aligns with its revenue performance. This tells us it maintained its per-share profitability as it expanded.
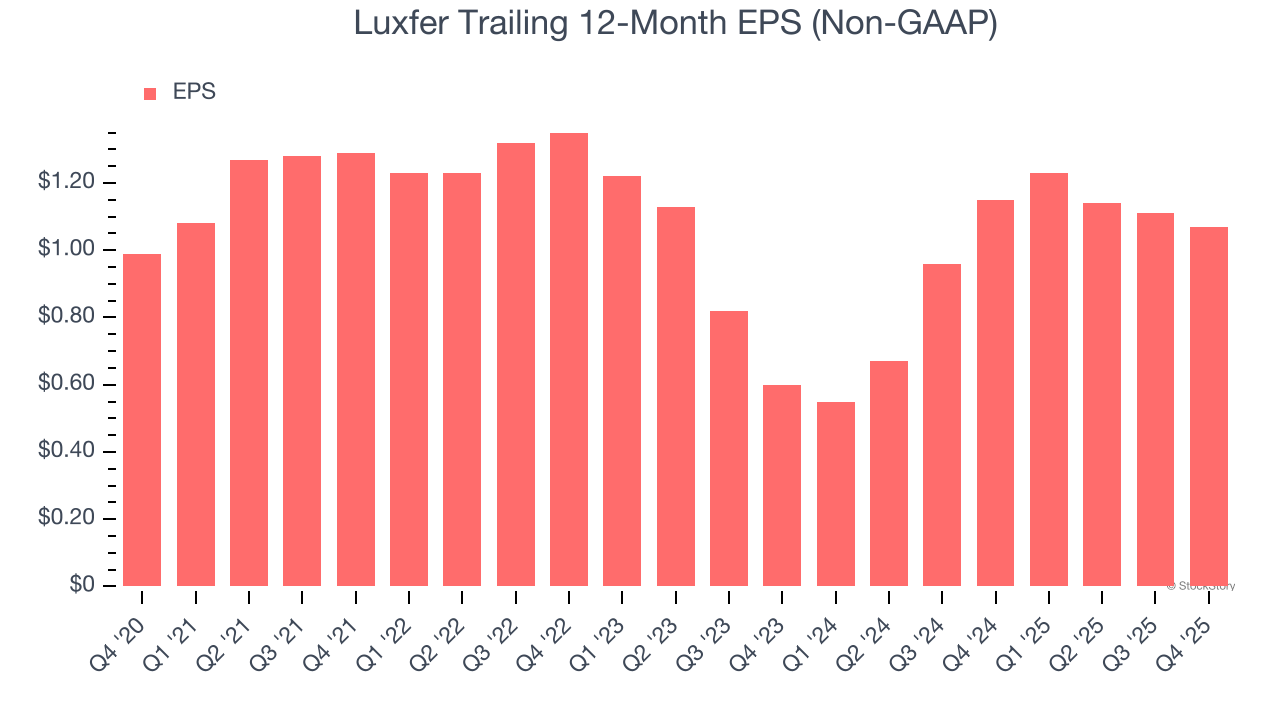
Like with revenue, we analyze EPS over a more recent period because it can provide insight into an emerging theme or development for the business.
Luxfer’s two-year annual EPS growth of 33.5% was fantastic and topped its two-year revenue performance.
We can take a deeper look into Luxfer’s earnings quality to better understand the drivers of its performance. While we mentioned earlier that Luxfer’s operating margin declined this quarter, a two-year view shows its margin has expanded. This was the most relevant factor (aside from the revenue impact) behind its higher earnings; interest expenses and taxes can also affect EPS but don’t tell us as much about a company’s fundamentals.
In Q4, Luxfer reported adjusted EPS of $0.24, down from $0.28 in the same quarter last year. This print was close to analysts’ estimates. Over the next 12 months, Wall Street expects Luxfer’s full-year EPS of $1.07 to grow 9.3%.
Key Takeaways from Luxfer’s Q4 Results
We were impressed by how significantly Luxfer blew past analysts’ EBITDA expectations this quarter. On the other hand, its revenue missed. Looking ahead, full-year EBITDA guidance missed, but full-year EPS guidance was in line. Overall, this was a mixed quarter. The stock remained flat at $15.55 immediately after reporting.
Should you buy the stock or not? The latest quarter does matter, but not nearly as much as longer-term fundamentals and valuation, when deciding if the stock is a buy. We cover that in our actionable full research report which you can read here (it’s free).