
Industrial cleaning equipment manufacturer Tennant Company reported Q4 CY2024 results topping the market’s revenue expectations, with sales up 5.6% year on year to $328.9 million. On the other hand, the company’s full-year revenue guidance of $1.23 billion at the midpoint came in 7.3% below analysts’ estimates. Its non-GAAP profit of $1.52 per share was 10.7% above analysts’ consensus estimates.
Is now the time to buy Tennant? Find out by accessing our full research report, it’s free.
Tennant (TNC) Q4 CY2024 Highlights:
- Revenue: $328.9 million vs analyst estimates of $323.3 million (5.6% year-on-year growth, 1.7% beat)
- Adjusted EPS: $1.52 vs analyst estimates of $1.37 (10.7% beat)
- Adjusted EBITDA: $47.4 million vs analyst estimates of $46.45 million (14.4% margin, 2% beat)
- Management’s revenue guidance for the upcoming financial year 2025 is $1.23 billion at the midpoint, missing analyst estimates by 7.3% and implying -4.4% growth (vs 3.5% in FY2024)
- Adjusted EPS guidance for the upcoming financial year 2025 is $5.95 at the midpoint, missing analyst estimates by 9.6%
- EBITDA guidance for the upcoming financial year 2025 is $202.5 million at the midpoint, below analyst estimates of $218.5 million
- Operating Margin: 2.3%, down from 8.4% in the same quarter last year
- Free Cash Flow Margin: 11.4%, down from 17.9% in the same quarter last year
- Market Capitalization: $1.64 billion
“We are pleased to report on Tennant's strong finish to a successful 2024. We achieved record results in 2024 with strong organic sales growth and margin expansion aligned with our long-range targets,” said Dave Huml, Tennant President and Chief Executive Officer.
Company Overview
As the world’s largest manufacturer of autonomous mobile robots, Tennant (NYSE: TNC) designs, manufactures, and sells cleaning products to various sectors.
Water Infrastructure
Trends towards conservation and reducing groundwater depletion are putting water infrastructure and treatment products front and center. Companies that can innovate and create solutions–especially automated or connected solutions–to address these thematic trends will create incremental demand and speed up replacement cycles. On the other hand, water infrastructure and treatment companies are at the whim of economic cycles. Consumer spending and interest rates, for example, can greatly impact the industrial production that drives demand for these companies’ offerings.
Sales Growth
A company’s long-term sales performance signals its overall quality. Even a bad business can shine for one or two quarters, but a top-tier one grows for years. Unfortunately, Tennant’s 2.5% annualized revenue growth over the last five years was sluggish. This fell short of our benchmarks and is a poor baseline for our analysis.
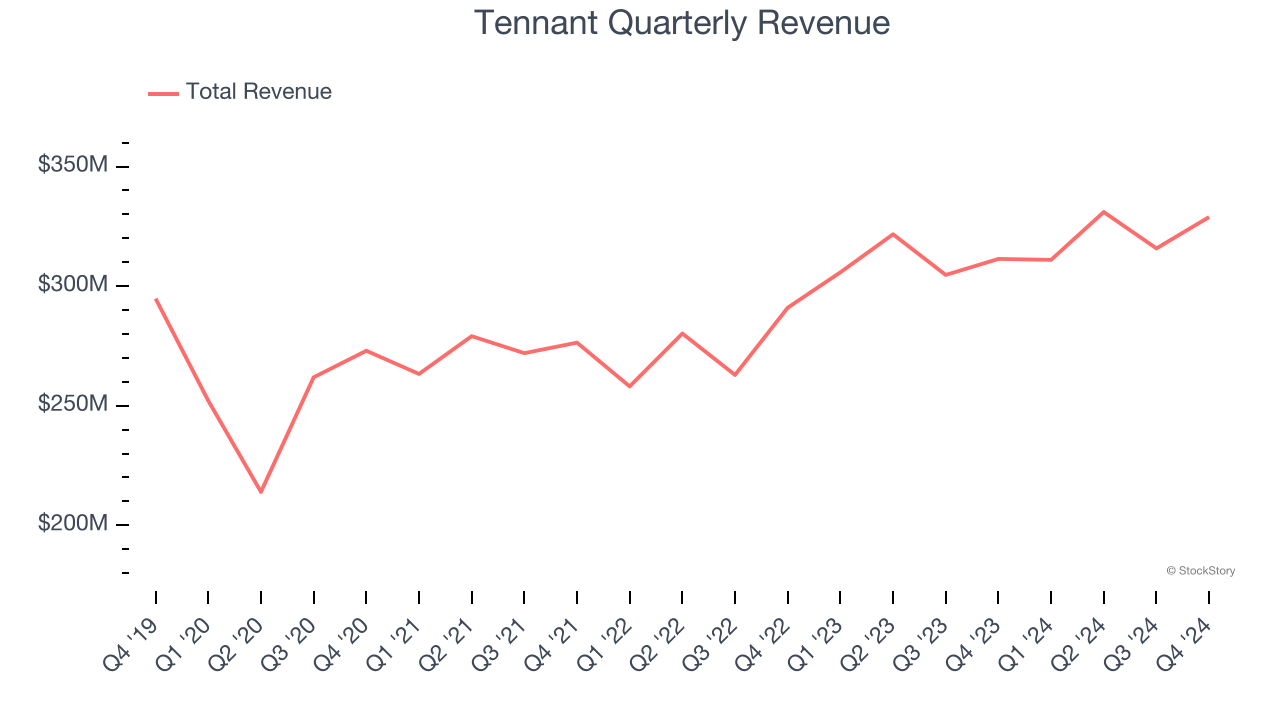
We at StockStory place the most emphasis on long-term growth, but within industrials, a half-decade historical view may miss cycles, industry trends, or a company capitalizing on catalysts such as a new contract win or a successful product line. Tennant’s annualized revenue growth of 8.5% over the last two years is above its five-year trend, suggesting some bright spots. 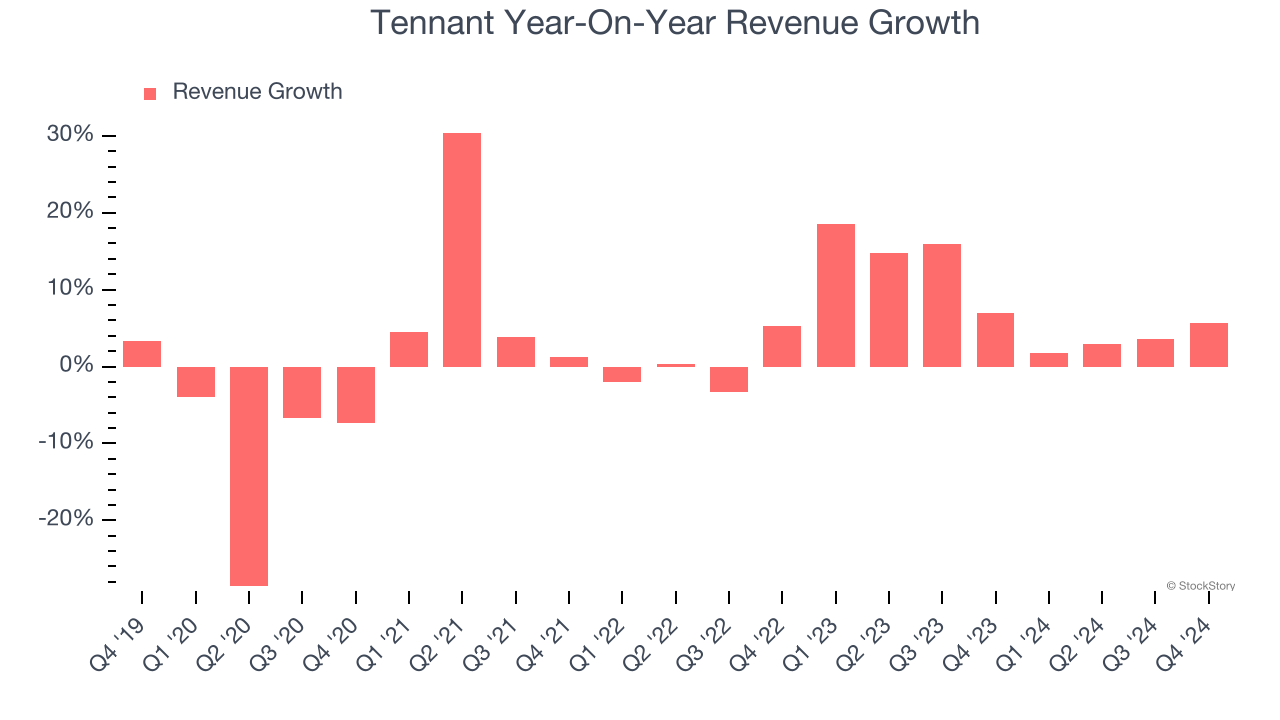
This quarter, Tennant reported year-on-year revenue growth of 5.6%, and its $328.9 million of revenue exceeded Wall Street’s estimates by 1.7%.
Looking ahead, sell-side analysts expect revenue to grow 3.1% over the next 12 months, a deceleration versus the last two years. This projection doesn't excite us and indicates its products and services will face some demand challenges.
Software is eating the world and there is virtually no industry left that has been untouched by it. That drives increasing demand for tools helping software developers do their jobs, whether it be monitoring critical cloud infrastructure, integrating audio and video functionality, or ensuring smooth content streaming. Click here to access a free report on our 3 favorite stocks to play this generational megatrend.
Operating Margin
Operating margin is a key measure of profitability. Think of it as net income - the bottom line - excluding the impact of taxes and interest on debt, which are less connected to business fundamentals.
Tennant has done a decent job managing its cost base over the last five years. The company has produced an average operating margin of 8.9%, higher than the broader industrials sector.
Looking at the trend in its profitability, Tennant’s operating margin rose by 1.7 percentage points over the last five years, showing its efficiency has improved.
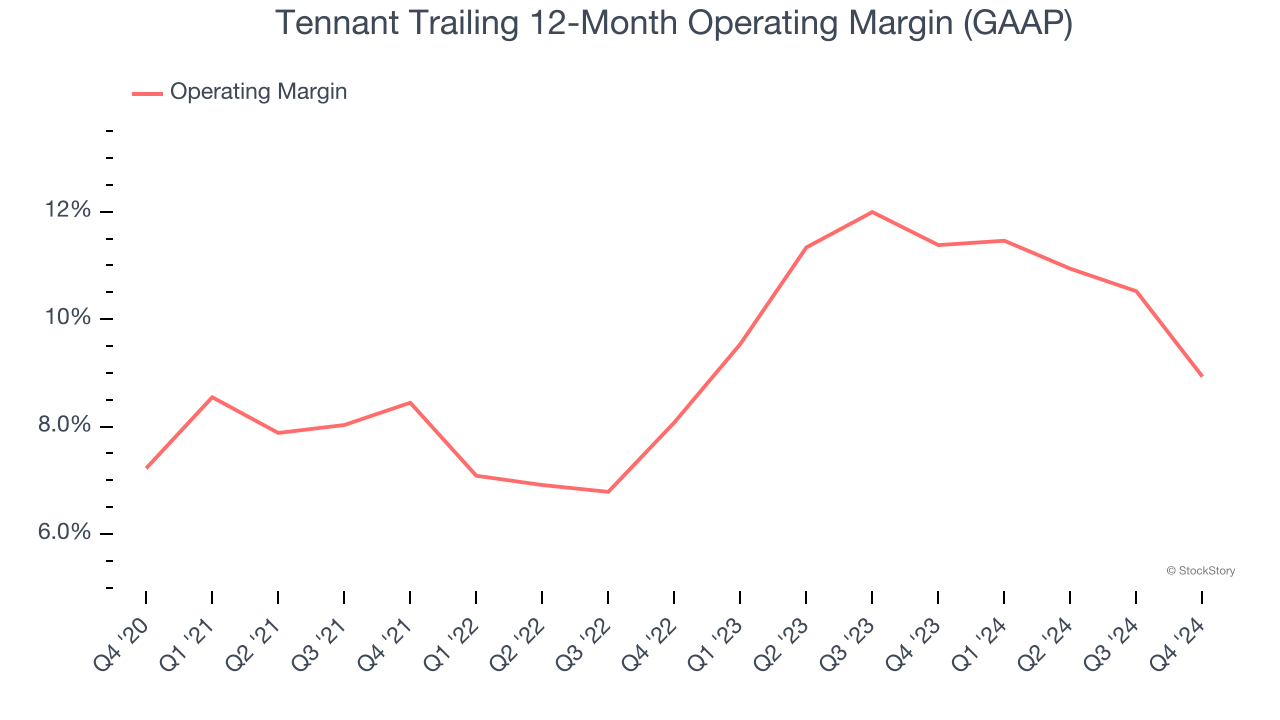
This quarter, Tennant generated an operating profit margin of 2.3%, down 6.1 percentage points year on year. Since Tennant’s operating margin decreased more than its gross margin, we can assume it was recently less efficient because expenses such as marketing, R&D, and administrative overhead increased.
Earnings Per Share
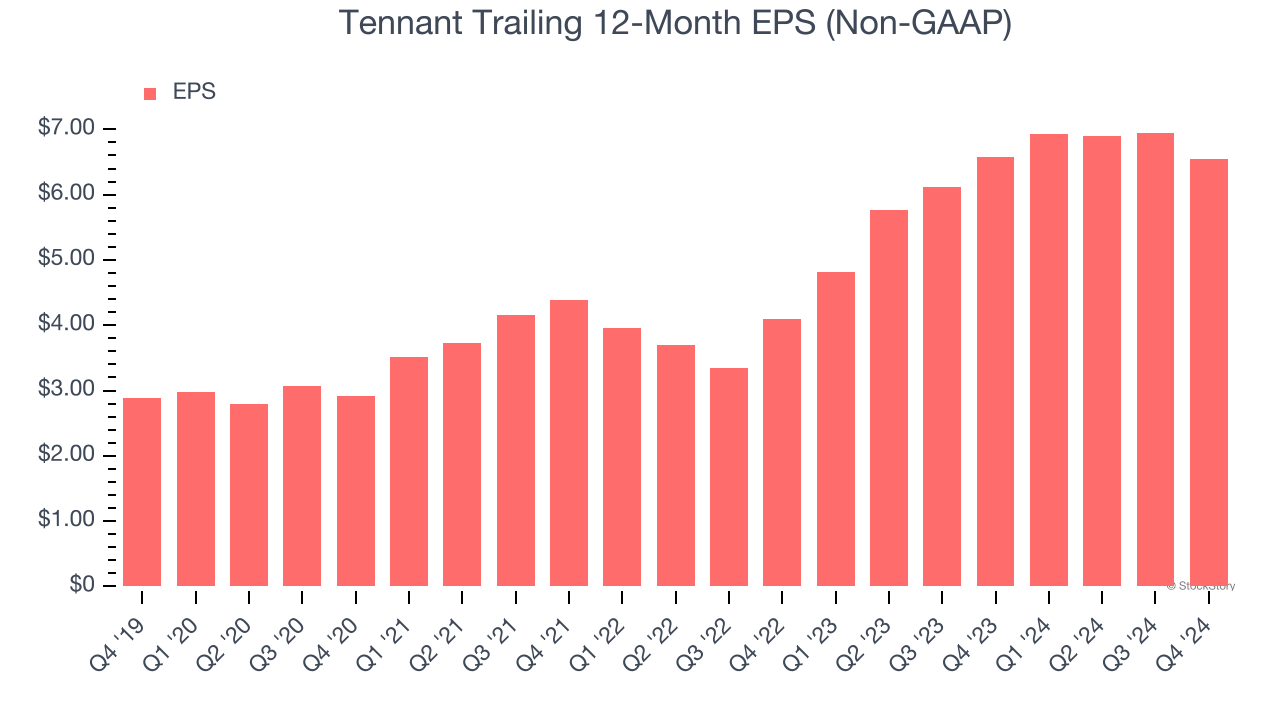
We track the long-term change in earnings per share (EPS) for the same reason as long-term revenue growth. Compared to revenue, however, EPS highlights whether a company’s growth is profitable.
Tennant’s EPS grew at an astounding 17.8% compounded annual growth rate over the last five years, higher than its 2.5% annualized revenue growth. This tells us the company became more profitable on a per-share basis as it expanded.
We can take a deeper look into Tennant’s earnings quality to better understand the drivers of its performance. As we mentioned earlier, Tennant’s operating margin declined this quarter but expanded by 1.7 percentage points over the last five years. This was the most relevant factor (aside from the revenue impact) behind its higher earnings; taxes and interest expenses can also affect EPS but don’t tell us as much about a company’s fundamentals.
Like with revenue, we analyze EPS over a shorter period to see if we are missing a change in the business.
For Tennant, its two-year annual EPS growth of 26.4% was higher than its five-year trend. We love it when earnings growth accelerates, especially when it accelerates off an already high base.
In Q4, Tennant reported EPS at $1.52, down from $1.92 in the same quarter last year. Despite falling year on year, this print easily cleared analysts’ estimates. Over the next 12 months, Wall Street expects Tennant’s full-year EPS of $6.55 to shrink by 4.4%.
Key Takeaways from Tennant’s Q4 Results
It was encouraging to see Tennant beat analysts’ revenue expectations this quarter. We were also happy its EPS and EBITDA outperformed Wall Street’s estimates. On the other hand, its full-year revenue, EPS, and EBITDA guidance fell short. Overall, the outlook could have been better, but the stock traded up 2% to $89.15 immediately after reporting.
So should you invest in Tennant right now? The latest quarter does matter, but not nearly as much as longer-term fundamentals and valuation, when deciding if the stock is a buy. We cover that in our actionable full research report which you can read here, it’s free.