
Industrial and Retail Led Property Indices While Office and Multifamily Lagged; the South Topped Regional Index Growth
This month’s CoStar Commercial Repeat Sale Indices (CCRSI) provides the market’s first look at commercial real estate pricing trends through March 2023. Based on 1,164 sale pairs in March 2023 and more than 289,037 repeat sales since 1996, the CCRSI offers the broadest measure of commercial real estate repeat sales activity.
This press release features multimedia. View the full release here: https://www.businesswire.com/news/home/20230428005331/en/
(Graphic: Business Wire)
CCRSI National Results Highlights
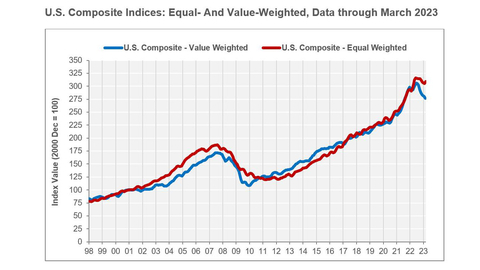
- U.S. COMPOSITE PRICE INDICES WERE MIXED IN MARCH 2023. The value-weighted U.S. Composite Index, more heavily influenced by high-value trades common in core markets, fell for the eighth consecutive month to 277, a decline of 1.3% over the prior month. The index also slumped 5.2% during the 12 months ending in March 2023.
- Conversely, the equal-weighted U.S. Composite Index, which reflects the more numerous but lower-priced property sales typical of secondary and tertiary markets, rose four points to 309 in March 2023, an increase of 1.3% over the prior month. The most recent uptick follows seven of the last eight months of declines. The index gained 4.8% during the 12 months ending in March 2023.
- Both composite indices have been on a broad deceleration trend in growth for the last nine months as markets respond to higher interest rates and falling tenant demand.
- THE EQUAL-WEIGHTED GENERAL COMMERCIAL COMPOSITE PRICE INDEX OUTPACED INVESTMENT GRADE IN MARCH 2023.
- The general commercial sub-index, more heavily influenced by smaller, lower-priced assets, gained 1.3% in March 2023, the second positive advance of the last five months. The index climbed 6.2% over the 12 months ending in March 2023.
- The investment grade sub-index, more heavily influenced by higher-value assets, declined by 1.4% in March 2023, retreating in seven of the last nine months. The index gave back 3.4% of value during the 12 months ending in March 2023, the fourth consecutive month of year-over-year price declines.
- OVERALL TRANSACTION VOLUME FELL 26% FROM THE PRIOR YEAR IN MARCH 2023. Composite pair volume of $169.4 billion in the 12 months ending in March 2023 marked a 26.3% decline from the 12 months ending in March 2022. The pullback in volume was more concentrated at the upper end of the market, with the Investment Grade segment plunging 31.1% in March 2023, compared to General Commercial’s shallower descent of 16.8% over the same period.
- DISTRESSED REPEAT-SALE TRADES REMAIN AT HISTORICALLY LOW LEVELS. Only 24 of the 1,164 repeat-sale trades in March 2023, or about 2.1%, were distressed sales. In comparison, the monthly average share of distressed sales in the five years ending in February 2020, before the onset of the pandemic, was 3.6%. General commercial accounted for 18 distressed trades, or 1.6% of all repeat-sales transactions in March 2023, below its five-year pre-pandemic monthly average of 2.6%. Only six investment grade distressed sales were recorded in the month, accounting for 0.5% of all repeat sales trades, below its five-year pre-pandemic monthly average of 1.1%.
Quarterly CCRSI Property Type Results
- PROPERTY TYPE PRICE FLUCTUATIONS WERE MIXED IN THE FIRST QUARTER. Including land and hospitality, the property type indices’ average price growth treaded water in the first quarter of 2023, up just 0.2%. Excluding these two market segments, the four main property types experienced the third consecutive quarter of average price declines, falling 1.2% in the most recent quarter. The primary market indices within each property sector, dominated by the large, core, coastal metros, fell at a similar pace of minus 1.4%, confirming that commercial property price declines have become broad-based.
- THE PRIME INDUSTRIAL INDEX LED GROWTH AMONG THE FOUR MAJOR PROPERTY TYPES. The Prime U.S. Industrial Index was up 2.5% in the first quarter of 2023 and 10.8% in the 12 months ending in March 2023. The equal-weighted U.S. Industrial Index, including a broader mix of asset qualities, underperformed the Prime Index with a modest decline of 0.1% in the quarter. The Prime Industrial Index was the only Prime property type index to hold in positive territory in the first quarter.
- THE IMPACT OF HIGHER INTEREST RATES WAS MOST VISIBLE IN THE MULTIFAMILY INDEX. The equal-weighted U.S. Multifamily Index fell by 2.4% in the first quarter of 2023 and dropped 2.2% in the 12 months ending in March 2023. The U.S. Multifamily Index showed the sharpest annual decline in values since the interest rate hiking cycle began in the first quarter of 2022. Debt for multifamily transactions was plentiful and drove investor demand in the sector. The index appreciated by 2.8% in the 12 months ending in March 2023 in Prime Multifamily markets but fell 2.8% in the quarter.
- OFFICE PRICE DECLINES CONTINUED IN THE FIRST QUARTER. The U.S. Office Index sagged 2.4% in the first quarter of 2023, taking its cumulative decline to minus 5% during the previous three quarters. Office prices were down 1.4% in the 12 months ending in March 2023, marking the first annual decline since the second quarter of 2012. In addition, pricing growth in the Prime Office Index advanced at a negligible pace of 0.4% in the 12 months ending in March 2023 while slumping 2.8% in the quarter.
- RETAIL PRICING FOOTED SIDEWAYS IN THE FIRST QUARTER. The U.S. Retail Index rose just 0.2% in the first quarter of 2023 and 3.3% in the 12 months ending in March 2023. The tendency of high-profile pair trends to swing the data around at the top end of retail space can lead to strong quarterly fluctuations. The U.S. Prime Retail Index dipped 2.6% in the first quarter while appreciating 12.3% over the year prior. The three-quarter trend in the Prime Retail Index saw values surge 9.9% in the third quarter of 2022 before giving back 2.8% and 2.6% in the fourth quarter of 2022 and the first quarter of 2023, respectively.
- U.S. HOSPITALITY INDEX REVERSED TWO QUARTERS OF PRICE DECLINES. The U.S. Hospitality Index was up 1.4% in the first quarter of 2023, contributing to annual gains of 2.7% in the 12 months ending in March 2023. Demand was strong in the luxury segment.
- U.S. LAND INDEX LED ALL PROPERTY TYPE SEGMENTS WITH 16.3% ANNUAL GROWTH. The U.S. Land Index is the most volatile of the property-type indices. After posting no growth in the prior quarter, the index bounced 4.7% in the first quarter, translating to an annual gain of 16.3% in the 12 months ending in March 2023. The U.S. Land Index reflects the heightened demand for development sites in recent years but should slow in the coming quarters as construction financing falls under increased scrutiny.
Quarterly CCRSI Regional Results
- QUARTERLY PRICE DECLINES EMERGE IN CERTAIN REGIONS, WITH THE SOUTH OUTPERFORMING. The four property types within each region produce 16 total property-type regions. Ten of the 16 showed price declines in the first quarter of 2023 over the prior quarter, while the remaining six reversed negative price momentum in the preceding quarter. The South Composite Index pared back some of the losses conceded in the fourth quarter of 2022 by appreciating across each property type in the first quarter of 2023. The index’s annual gains were led by industrial at 10.5% over the prior 12-month period, while retail and multifamily grew at 5.3% and 4.5%, respectively. The South Office Index rose 3.8% over the preceding year.
- OFFICE AND INDUSTRIAL DROVE ANNUAL PRICE GAINS IN THE NORTHEAST. The Northeast Composite Index advanced by 5.3% in the 12 months ending in March 2023, the most substantial annual growth rate among the four regions. Its outperformance was due to solid growth in the Northeast Industrial Index at 9.7% and the Northeast Office Index at 10.9%, influenced by the surge in life sciences demand. As a result, the office sector in the Northeast signified the most robust annual growth rate among the 16 regional property type indices. Meanwhile, the Northeast Multifamily Index expanded by 3.2% over the previous year, and the Retail Index faired similarly at 3.1%. However, the northeast indices experienced negative quarterly price momentum, led by industrial, down 2.2%, and retail, giving back 2%. The office and multifamily indices also edged lower, slashing 1.9% off their values from the prior quarter.
- THE MIDWEST SHOWED MIXED PERFORMANCE AS INDUSTRIAL PROVED TO BE A BRIGHT SPOT. On an annual basis, the Midwest Composite Index climbed 2.5% in the first quarter of 2023, while the quarterly gain of 1.3% reversed two consecutive months of declines. Three property sectors in the midwestern indices soured performance with negative pricing over the prior year. Uniquely, industrial showed strength, growing 6.8% over the preceding year, while the indices for office, retail, and multifamily contracted by 2.6%, 0.9%, and 0.7%, respectively.
- WESTWARD EXPANSION SLOWED. The West Composite Index ended the first quarter of 2023 at minus 2.3% compared to the prior quarter. The index also fell 2.1% over the 12 months ending in the first quarter of 2023. Of the 16 property-type regions, the West’s Multifamily Index fared the worst by declining 6.3% over the prior year and finishing in the red for the third consecutive quarter, down 2.2% to start the year.
Monthly CCRSI Results, Data through March 2023 |
||||
|
1 Month
|
1 Quarter
|
1 Year
|
Trough to
|
Value-Weighted U.S. Composite Index |
-1.3% |
-2.4% |
-5.2% |
156.1%1 |
Equal-Weighted U.S. Composite Index |
1.3% |
0.5% |
4.8% |
158.7%2 |
U.S. Investment-Grade Index |
-1.4% |
-5.8% |
-3.4% |
161.1%3 |
U.S. General Commercial Index |
1.3% |
1.4% |
6.2% |
158.3%4 |
1 Trough Date: January 2010 2 Trough Date: March 2011 3 Trough Date: October 2009 4 Trough Date: March 2011 |
||||
About The CoStar Commercial Repeat-Sale Indices
The CoStar Commercial Repeat-Sale Indices (CCRSI) are the most comprehensive and accurate measures of commercial real estate prices in the United States. In addition to the national Composite Index (presented in both equal-weighted and value-weighted versions), national Investment-Grade Index, and national General Commercial Index, which are reported monthly, 30 sub-indices in the CoStar index family are reported quarterly. The sub-indices include breakdowns by property sector (office, industrial, retail, multifamily, hospitality, and land), by region of the country (Northeast, South, Midwest, and West), by transaction size and quality (general commercial, investment-grade), and by market size (composite index of the prime market areas in the country).
The CoStar indices are constructed using a repeat sales methodology, widely considered the most accurate measure of price changes for real estate. This methodology measures the movement in the prices of commercial properties by collecting data on actual transaction prices. When a property is sold more than once, a sales pair is created. The prices from the first and second sales are then used to calculate price movement for the property. The aggregated price changes from all the sales pairs are used to create a price index. Historical price indices are revised as additional repeat transactions are recorded.
Available Monthly and Quarterly CCRSI Indices
|
||||
National
|
National
|
Regional
|
Regional
|
Prime
|
All Properties |
Office |
Northeast |
Northeast: Office, Multifamily, Industrial, Retail |
Office |
General Commercial |
Retail |
Midwest |
Midwest: Office, Multifamily, Industrial, Retail |
Multifamily |
Investment-Grade |
Industrial |
South |
South: Office, Multifamily, Industrial, Retail |
Industrial |
|
Multifamily |
West |
West: Office, Multifamily, Industrial, Retail |
Retail |
|
Hospitality |
|
|
|
|
Land |
|
|
|
Prime Office Markets |
|
Prime Industrial Markets |
||
CBSA Listed Alphabetically |
|
|
CBSA Listed Alphabetically |
|
Boston |
|
|
Atlanta |
|
|
Los Angeles |
|
|
Chicago |
|
New York |
|
|
Dallas |
|
Orange County |
|
|
Houston |
|
San Francisco |
|
|
Los Angeles |
|
Seattle |
|
|
Northern New Jersey |
|
Washington, D.C. |
|
|
Riverside |
|
|
|
|
Seattle |
|
|
|
||
Prime Retail Markets |
|
Prime Multifamily Markets |
||
|
CBSA Listed Alphabetically |
|
|
CBSA Listed Alphabetically |
|
Boston |
|
|
Boston |
|
Los Angeles |
|
|
Chicago |
|
New York |
|
|
Houston |
|
Orange County |
|
|
Los Angeles |
|
San Diego |
|
|
New York |
|
San Francisco |
|
|
Orange County |
|
San Jose |
|
|
San Francisco |
|
Washington, D.C. |
|
|
San Jose |
|
|
|
|
Seattle |
|
|
|
|
Washington, D.C. |
For more information about the CCRSI Indices, including the full accompanying data set and research methodology, legal notices, and disclaimer, please visit http://costargroup.com/costar-news/ccrsi.
About CoStar Group
CoStar Group (NASDAQ: CSGP), is a leading provider of online real estate marketplaces, information, and analytics in the property markets. Founded in 1987, CoStar conducts expansive, ongoing research to produce and maintain the largest and most comprehensive database of commercial real estate information. Our suite of online services enables clients to analyze, interpret and gain unmatched insight on commercial property values, market conditions and current availabilities. STR provides premium data benchmarking, analytics, and marketplace insights for the global hospitality industry. Ten-X provides a leading platform for conducting commercial real estate online auctions and negotiated bids. LoopNet is the most heavily trafficked commercial real estate marketplace online. Apartments.com, ApartmentFinder.com, ForRent.com, ApartmentHomeLiving.com, Westside Rentals, AFTER55.com, CorporateHousing.com, ForRentUniversity.com and Apartamentos.com form the premier online apartment resource for renters seeking great apartment homes and provide property managers and owners a proven platform for marketing their properties. Homesnap is an industry-leading online and mobile software platform that provides user-friendly applications to optimize residential real estate agent workflow and reinforce the agent-client relationship. Homes.com is the fastest growing online residential marketplace that connects agents, buyers, and sellers. BureauxLocaux is one of the largest specialized property portals for buying and leasing commercial real estate in France. Business Immo is France’s leading commercial real estate news service. CoStar Group’s websites attract tens of millions of unique monthly visitors. Headquartered in Washington, DC, CoStar Group maintains offices throughout the U.S., Europe, Canada, and Asia. From time to time, we plan to utilize our corporate website, CoStarGroup.com, as a channel of distribution for material company information. For more information, visit CoStarGroup.com.
View source version on businesswire.com: https://www.businesswire.com/news/home/20230428005331/en/
Contacts
News Media:
Matthew Blocher
Vice President
CoStar Group Corporate Marketing & Communications
(202) 346-6775
mblocher@costar.com


