If you want to know why the S&P 500 Index ($SPX) feels like it’s walking through a minefield, stop looking at the Fed and start looking at the Strait of Hormuz. For many of us, we are going back to 1990 to recall just how important it is. It is very important, and perhaps no more so than right now.
The Strait of Hormuz is a body of water that forms a sort of elbow shape just to the south of Iran and to the east of the Persian Gulf, the start of modern regional turmoil involving the United States. The strait is where much of the world’s oil supply moves through every day. For instance, most of India’s imported oil is transported via the Strait of Hormuz.
We are currently witnessing essentially a “commodity contagion,” in which oil and strategic metals aren't just acting as inflation hedges — they are actively destabilizing the equity market's plumbing.
While I read that oil (CBK26) prices have not been this volatile in several years, as one who focuses more on stocks and bonds than commodities, I cannot recall oil ever doing what it did Sunday night into Monday morning. It has been nothing short of disturbing. And the receding price later in the day on Monday into Tuesday does not change that.
How To Manage Oil Price Volatility
To me, risk management is the priority. And when I see moves like that, it tells me that the range of possible outcomes just got much wider. See the “never just one cockroach” theory.
Watching oil whip from nearly $120 per barrel — a level that historically can trigger U.S. recessions — back toward $100 in a single session tells you everything you need to know about price discovery right now: There is none.
It is pure headline-driven panic. When the Strait of Hormuz becomes a literal chokehold on 20% of the world's oil supply, the market stops caring about earnings and starts pricing in stagflation.
This isn't just an energy story. It’s a supply-chain-weaponization story. We see it in the Vaneck Rare Earth Strategic Metals ETF (REMX), where the premium for Western-sourced minerals over Chinese supply has reached an absurd 60% to 400%. This “political football” is being kicked around ahead of the China summit, and it’s creating a massive disconnect between stock prices and economic reality.
For the average investor, this looks like just another rotation into energy and materials. Find your favorite oil stock, it is likely way up in the past month.
But to me, it looks like a trap. The CBOE Volatility Index ($VIX) spiking to 31 and the 10-year Treasury (ZNM26) yield diving to 4.1% were the market's way of screaming that this commodity surge is a tax on growth, not a sign of it. We are in a high-voltage environment where one errant headline out of Tehran or a social media post from the administration can erase a week's worth of gains in an hour.
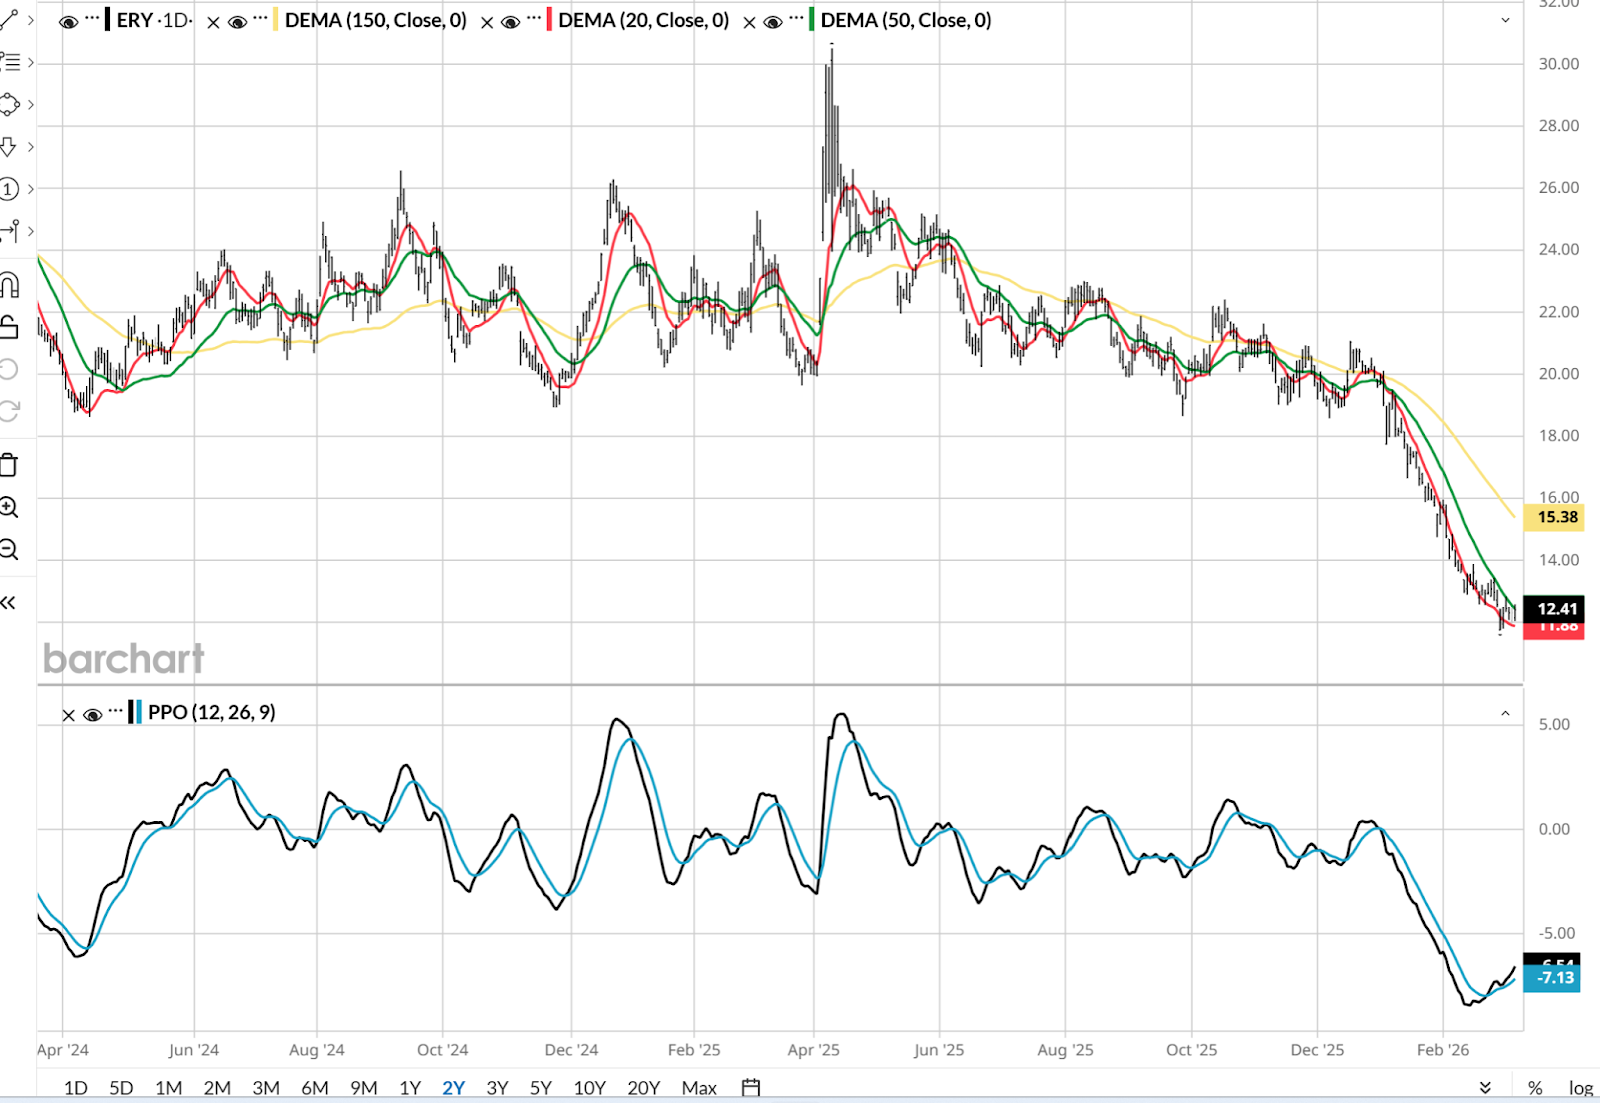
Still, I’m an equal opportunity chartist. And while everything at this point is no more than a “trade” to me when it comes to energy, if this is a temporary end to the price spike we just saw, one exchange-traded fund (ETF) that catches my eye is the Direxion Daily Energy Bear 2X (ERY).
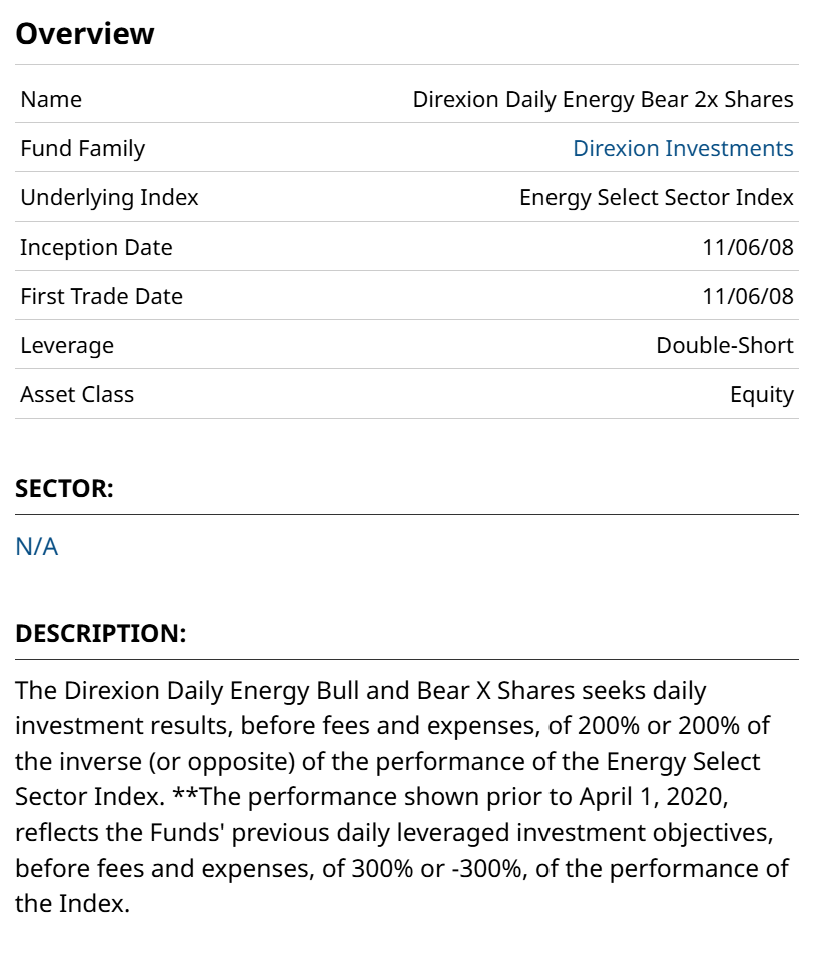
It is a small ETF, and a 2x leveraged one, so be careful when considering it. It has been around since 2008, which is comforting. And to be clear, it double shorts the big energy stocks that make up the S&P 500 energy sector, which is known to many via the S&P 500 Energy Sector SPDR (XLE).
The best-case scenario for ERY would be for energy stocks to drop because the stock market falls, even if the price of oil stays range-bound for a while. But this is oil we are talking about, so expecting it to sit still, even overnight, is not a high-percentage shot.
Rob Isbitts created the ROAR Score, based on his 40+ years of technical analysis experience. ROAR helps DIY investors manage risk and create their own portfolios. For Rob's written research, check out ETFYourself.com.
On the date of publication, Rob Isbitts did not have (either directly or indirectly) positions in any of the securities mentioned in this article. All information and data in this article is solely for informational purposes. For more information please view the Barchart Disclosure Policy here.
More news from Barchart