
Silver has long been like the lesser-known, younger brother to gold, despite having much more commercial and industrial value than the yellow metal. But in 2025, silver rightfully entered the spotlight alongside the highly acclaimed gold.
So, with the biggest ETF tracking silver, the iShares Silver Trust ETF (SLV), having reached its all-time high, then adding another 30% beyond that in just the past couple of months, it sets up a familiar situation for traders. One that is not specific to SLV and silver.
I’m talking about how silver’s technical chart pattern is one I’d call “in uncharted territory.” And that deserves a different type of analysis from the usual acknowledgement of key price levels. There’s no new high to shoot for with SLV, when it is hitting one nearly every day.
But we’ve seen this with stocks and sectors before. We even saw it with the Nasdaq-100 Index ($IUXX), which went parabolic in late 1999 and early 2000, before proceeding to give it all back, and more. All in the space of about 12 months.
When markets push up the price of a commodity to such heights, it tends to be more capable of moving widely in either direction afterward. That’s because the market has many types, and two of them are highly appreciated holders and speculators looking to play the ongoing momentum.
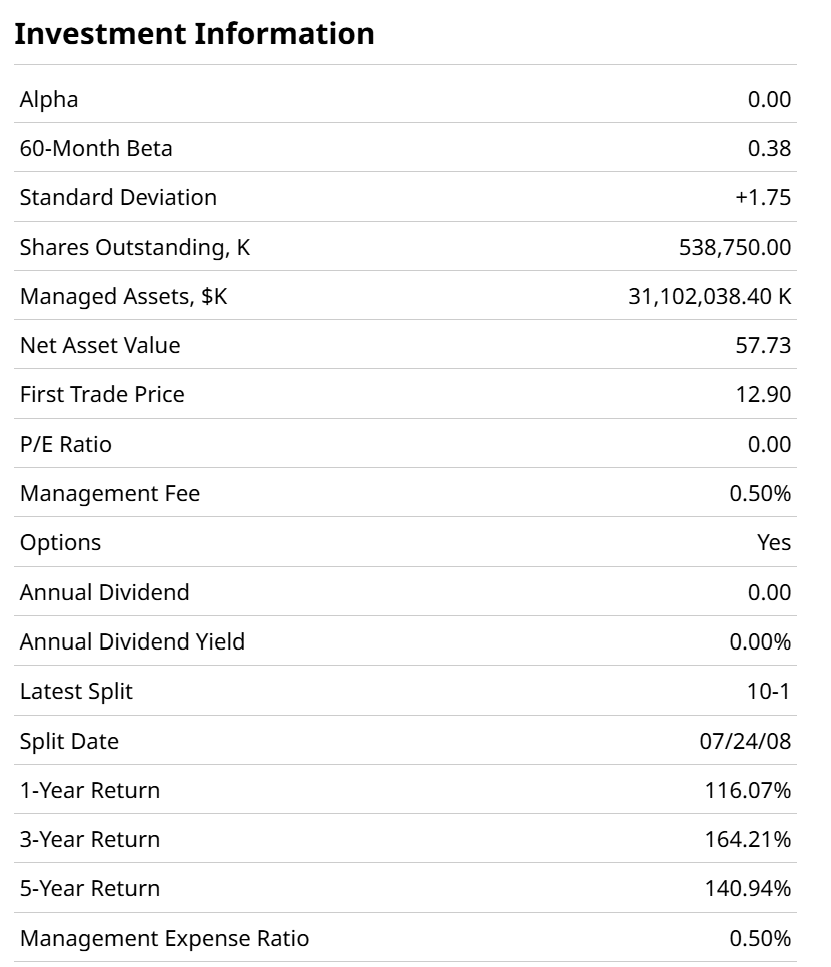
SLV has been a low-beta ETF historically, but not lately. And its $31 billion in assets makes it very easy to trade, including via options, as I’ll explore below via a collar.
How to Analyze SLV’s Price Chart
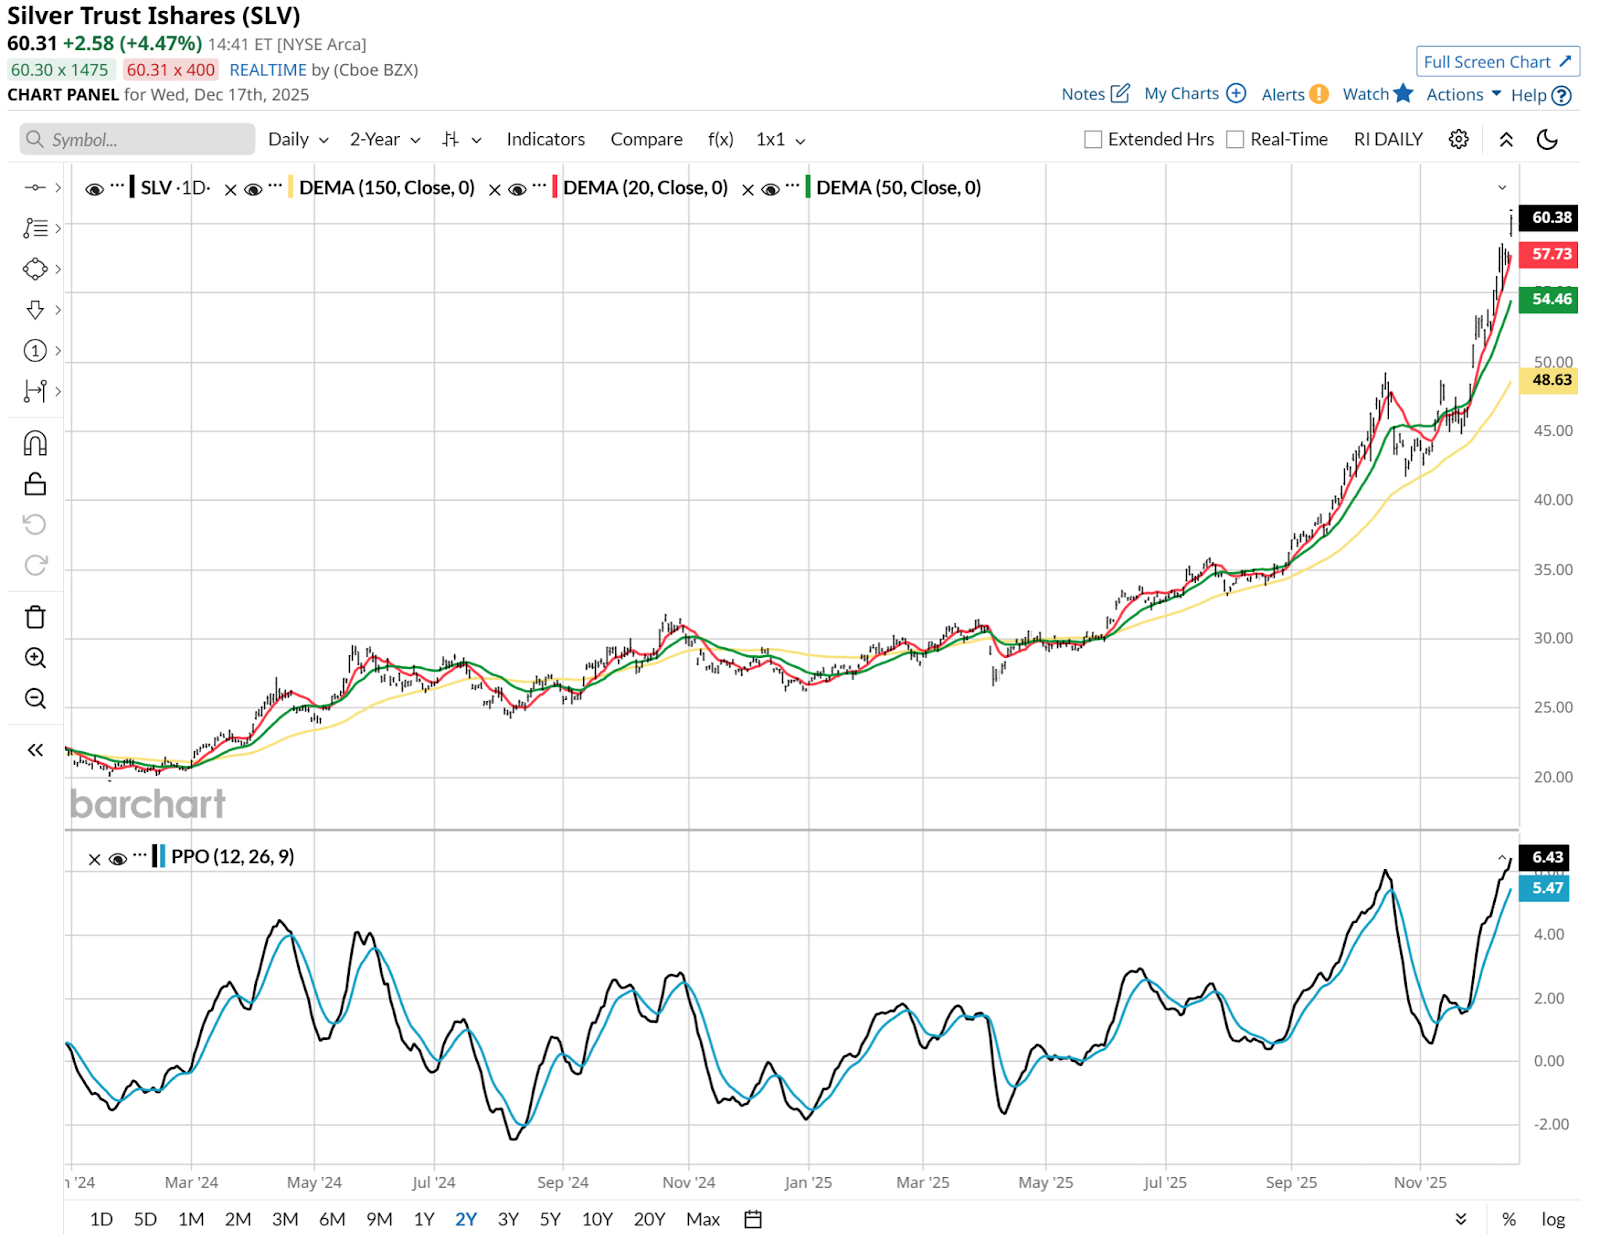
That’s quite a move. But the first thing I see in that daily view below is the Percentage Price Oscillator (PPO) having reached a potential double top. The ETF’s path is one thing, but the PPO is an oscillating indicator. It tries to answer the question “how high is too high?” On a daily view, it has more likely reached that point than not.
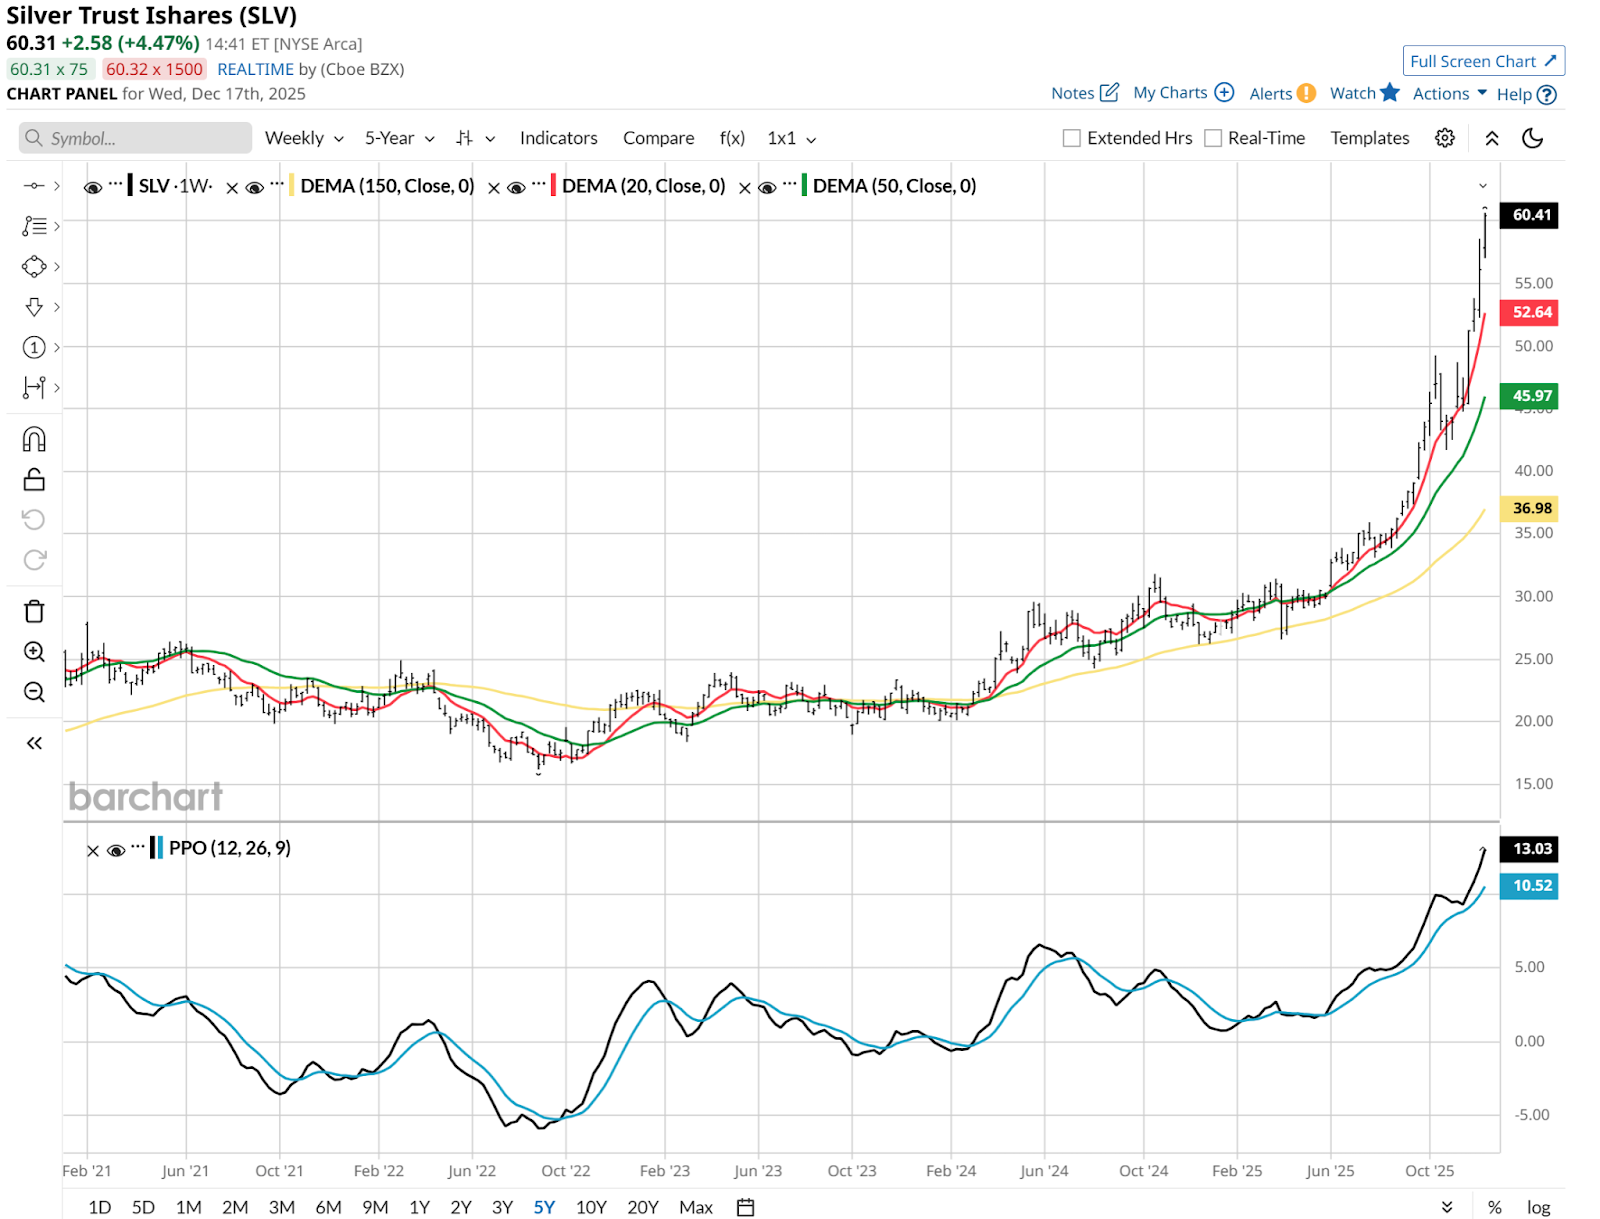
But what really gets my risk manager brain going on SLV is this. The weekly chart is way up there too, in PPO terms. Still, until the move stops, there’s no signal of significance. As they say, an object in motion stays in motion.
SLV Is Breaking Multi-Decade Records. What That Means for Traders.
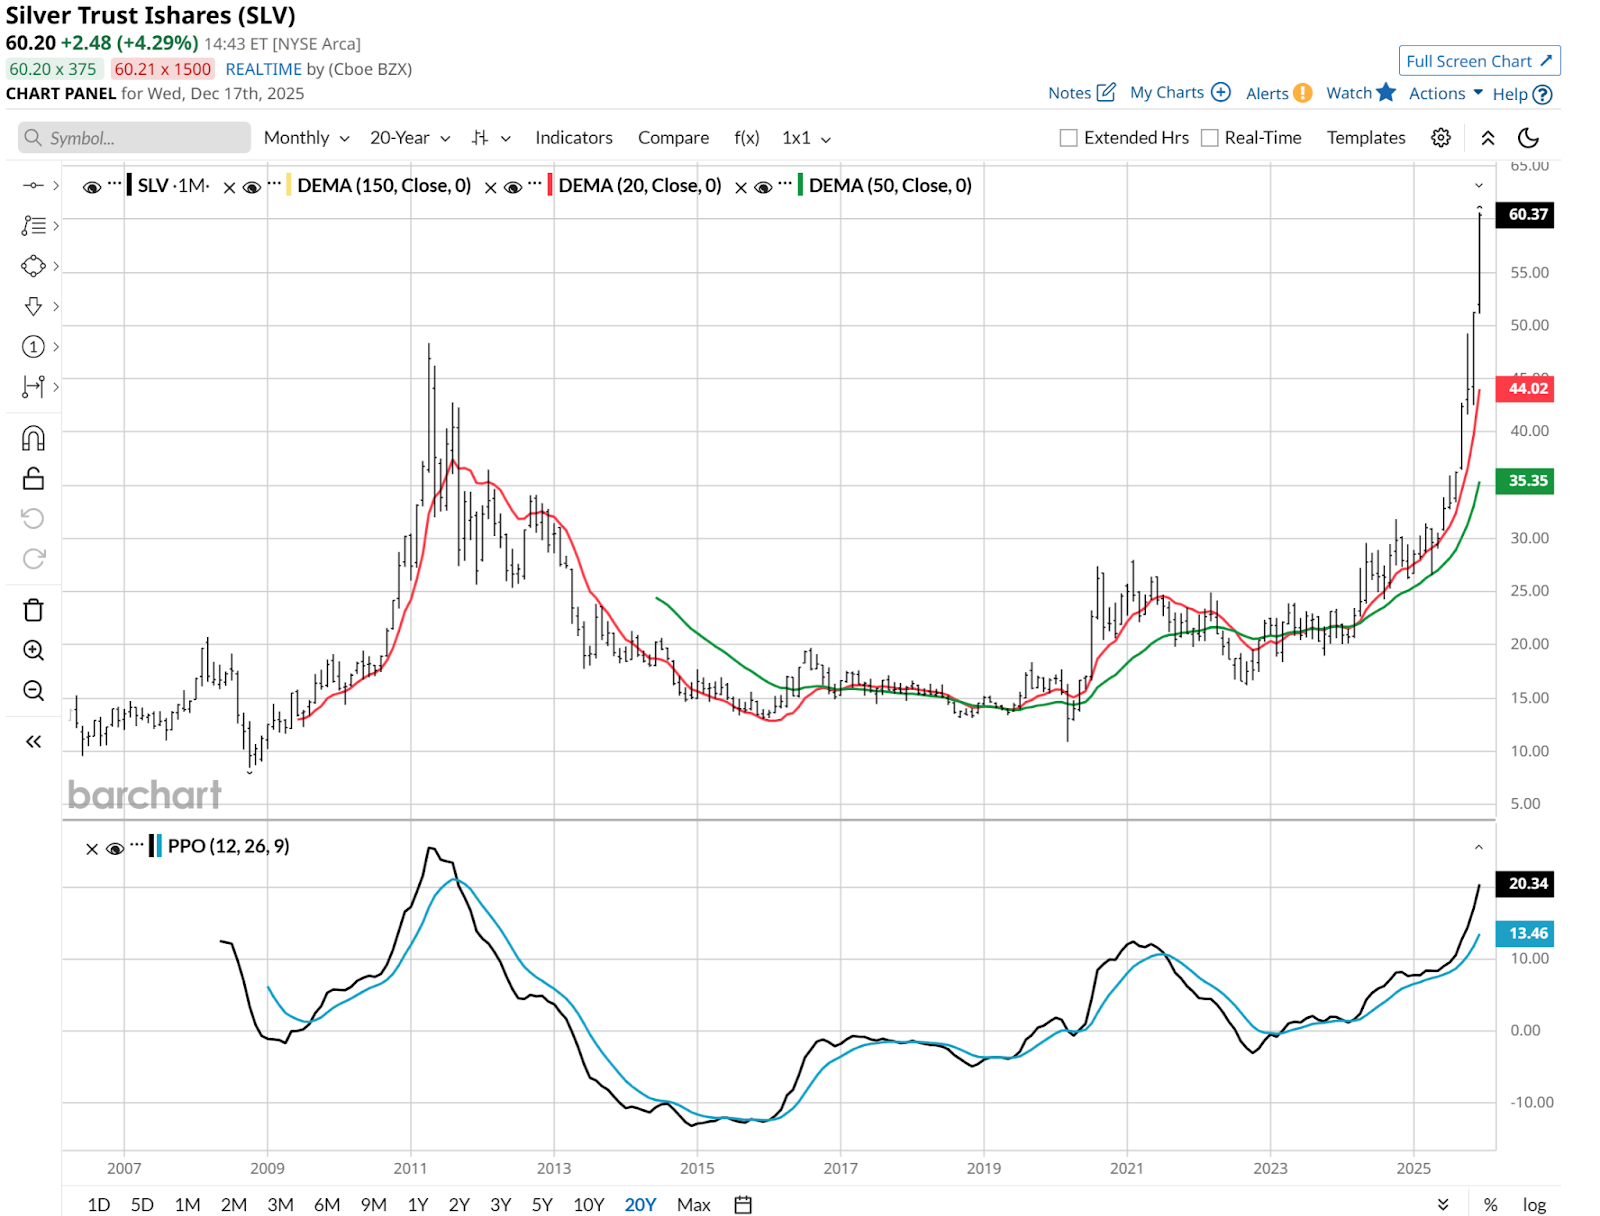
This move in SLV is so historic, I wanted to take in more history. This monthly chart below, going back to the ETF’s inception in 2006, nearly 20 years ago, puts it in perspective. So does the PPO, which is still not at the all-time high level reached back in 2011. That’s a bullish sign in and of itself.
Of the many collar possibilities here, I landed on this one because it goes out just far enough to see what will happen. Three months is plenty of time for the market to create a strong trend in some direction for SLV. With the collar, I don’t care which direction as much as I would if I owned it without options.

But by taking 100 shares of SLV and adding a covered call at $76 and a protective put at $60, I set up a range in which I can make 20% on SLV in a best-case scenario, while limiting losses to 6%. The takeaway here is that this same structure and thought process can be applied to any parabolic situation in the markets, be they commodities, stocks, indexes or other liquid assets.
Rob Isbitts, founder of Sungarden Investment Publishing, is a semi-retired chief investment officer, whose current research is found here at Barchart, and at his ETF Yourself subscription service on Substack. To copy-trade Rob’s portfolios, check out the new Pi Trade app.
On the date of publication, Rob Isbitts did not have (either directly or indirectly) positions in any of the securities mentioned in this article. All information and data in this article is solely for informational purposes. For more information please view the Barchart Disclosure Policy here.
More news from Barchart
- Silver Prices Are Flying. Should You Try to Catch the Rally, or Bet Against It?
- How to Turn the Volatility in Tesla Stock into a 20% Upside Opportunity with Just 0.3% Downside Risk
- This Unusually Active Avantor Put Raises the Question: Who’s the Patsy?
- Exposing the Hidden Geometry of Palo Alto (PANW) Stock Most Investors Will Miss


